The short answer
Water damage statistics on this page come only from our own 36 research reports, each computed from a public federal or state file with its method published. In the 2023 Census American Housing Survey 15.4% of occupied US homes reported a water leak in the previous 12 months, while FEMA data put a flood insurance policy on just 2.89% of US homes.
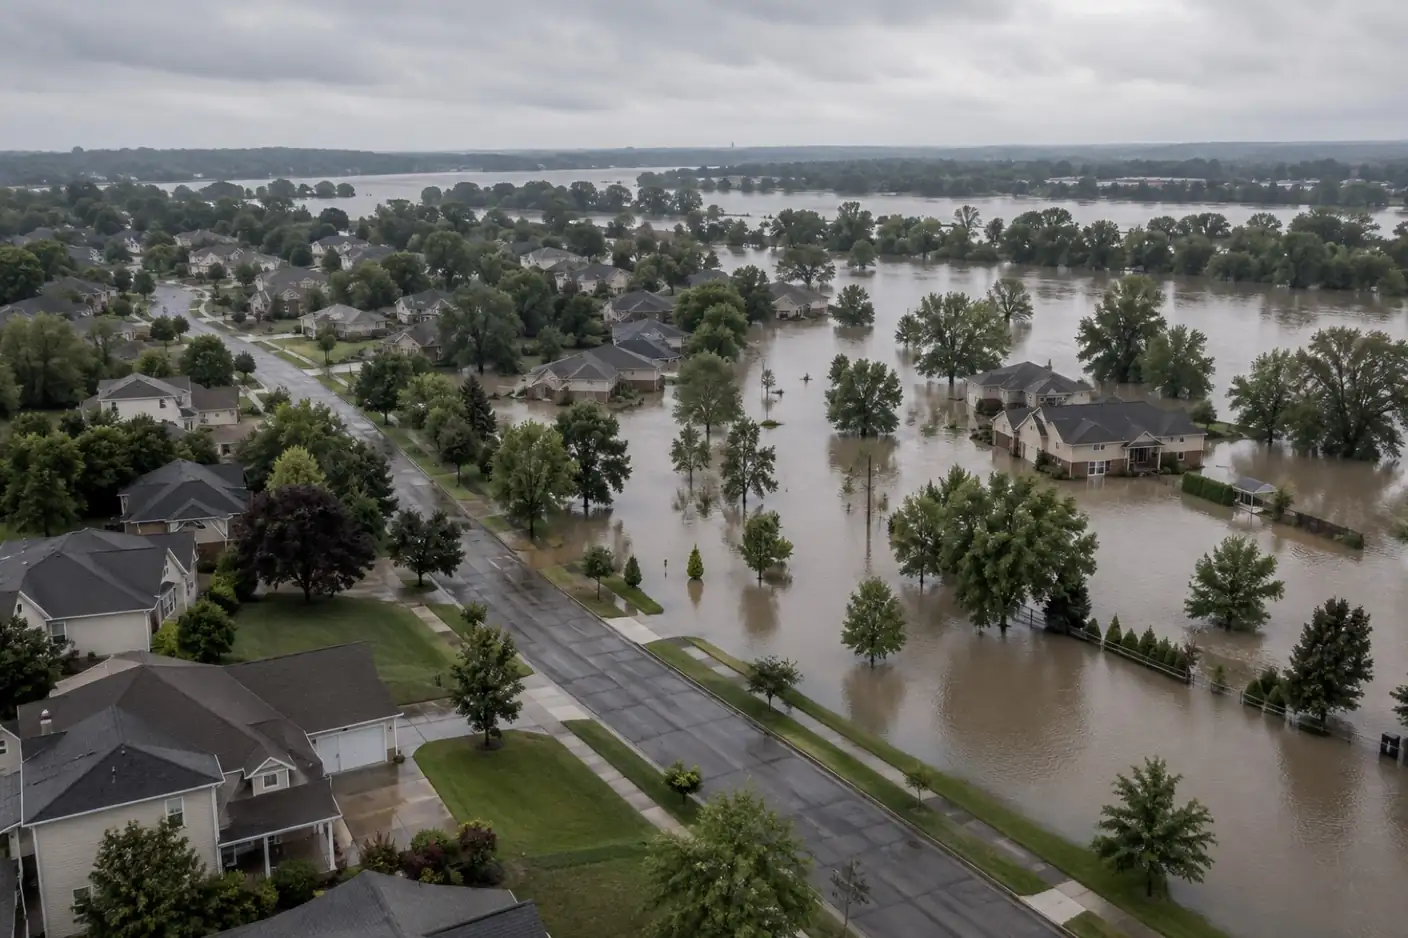
Headline figures
Start here
- How Common Are Water Leaks in Homes? About 3 in 20 Homes a Year: the baseline: how often water gets into ordinary homes, and from where.
- The Water Depth Damage Curve: 626,886 NFIP Claims Analysed: what each foot of floodwater does to the claim, from FEMA’s own file.
- Percentage of Homes With Flood Insurance: The County Take-Up Map: how few homes carry flood cover, county by county.
On this page
How these water damage statistics are built
Every figure on this page comes from one of our 36 research reports, and every report is computed from a public file that anyone can download: the Census Bureau’s American Housing Survey, FEMA’s OpenFEMA datasets, NOAA’s storm and disaster records, SBA disaster loan data, BLS wage and establishment counts, and state licence registers. Each line below names its source and links to the report that holds the full method, the exclusions and the tables.
This page is organised by question, not by dataset. If you want the instruments themselves, with endpoints, queries, row counts and retrieval dates, the research index lists all 35 instruments with methods. The standing rules that apply to all of them, from how we treat placeholder values to how we round, are on the methodology page.
Three habits make these figures safer to quote than most of what circulates. First, each one carries its unit: a FEMA registration is not a person, an NFIP claim is not a household, and a county declaration is not a disaster. Second, medians are preferred to means wherever a few catastrophic losses would distort an average. Third, nothing here is a market estimate or a survey we ran ourselves. Widely repeated water damage figures that cannot be traced to a named dataset are not repeated on this page.
Household leaks and mold
The American Housing Survey is the only national source that asks households directly whether water got in, so it is the closest thing to a census of everyday water damage. It counts events of any size, from a drip under a sink to a flooded basement, which is why its rates are far higher than any insurance or disaster series.
- 15.4% of occupied US homes reported a water leak in the 12 months before their 2023 interview, about 20.5 million homes, or roughly 3 in 20 (source: Census AHS 2023; report: How common are water leaks in homes).
- 44% of homes with an inside leak named leaking pipes, about 4.9 million homes in a year (source: Census AHS 2023; report: Household water leak report).
- 50% of homes with an outside leak said the water came through the roof (source: Census AHS 2023; report: Household water leak report).
- 22.5% of homes built in 1939 or earlier reported a leak, against 8.2% of homes built in 2010 or later (source: Census AHS 2023; report: Household water leak report).
- 3.0% of occupied US homes, about 3.9 million, reported mold at least the size of a sheet of letter paper in the past 12 months (source: Census AHS 2023; report: Percentage of homes with mold).
- 6.7x the mold rate in homes with a leak: 10.6% of homes with a leak reported mold, against 1.6% of homes with none (source: Census AHS 2023; report: Percentage of homes with mold).
- 48% of homes reporting mold had it in a bathroom, and renters reported mold at 5.1% against 1.9% for owners (source: Census AHS 2023; report: Percentage of homes with mold).
Age is the clearest gradient in the survey, and it runs in one direction: every older band of housing reports more leaks than the band after it. The survey cannot say which part of the house failed in each case, but the leak report’s source tables show pipes leading inside and roofs leading outside. For what those leaks mean on site, the water damage hub walks through the restoration process.
Flood claims, water depth and damage
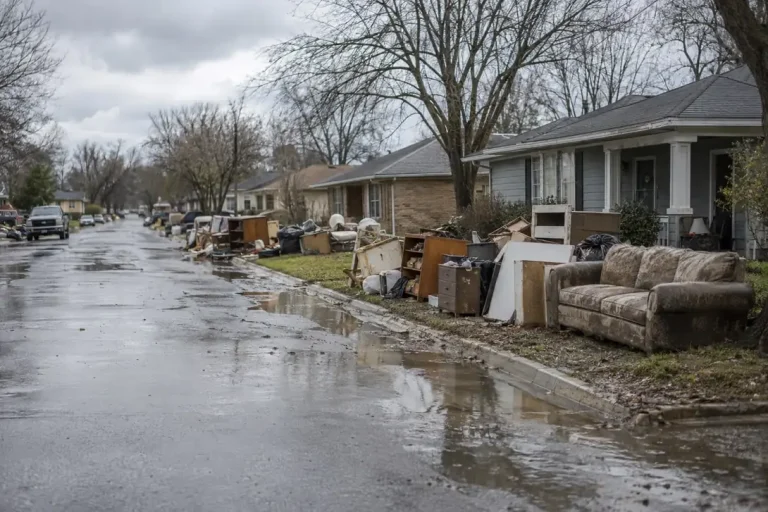
The National Flood Insurance Program’s claims file is the largest public record of what water does to buildings, with 626,886 claims filed since 2015 in the FEMA extract our reports use. It only covers insured flood losses, so it says nothing about burst pipes or uninsured homes, but within that scope it is detailed enough to measure depth, contents, occupancy and zone.
- 3.3x the rise in median building damage across the first two feet of water, from $18,842 to $63,020; at five feet the median is $68,449 (source: FEMA OpenFEMA NFIP claims; report: The water depth damage curve).
- 67.8% of NFIP building claims since 2015 come from Florida, Texas and Louisiana, but per head Louisiana leads with 1,298 claims per 100,000 residents against 656 for Florida (source: FEMA OpenFEMA and US Census Bureau; report: Flood claims by state).
- 28.6% of NFIP flood claims since 2015 come from B, C or X zones outside the mapped high-risk area, a floor rather than an estimate because cover there is voluntary (source: FEMA OpenFEMA; report: The flood zone exposure report).
- 1.26x non-residential median flood damage against residential: $45,124 against $35,792, widening to 1.65 times on means (source: FEMA OpenFEMA; report: Flood loss by building type).
- 28% median contents damage as a share of building damage on an NFIP claim, $14,816 against $60,366, ranging from 35.5% in Texas to 13.9% in New York (source: FEMA OpenFEMA; report: The contents restoration report).
- 3.9x the swing in the inflation-adjusted median NFIP claim between 2020 ($17,179) and 2024 ($66,458), in 2024 dollars, which tracks each year’s largest flood rather than a steady rise (source: FEMA OpenFEMA and BLS CPI-U; report: Inflation-adjusted flood damage).
- 338 of the 1,089 US flash flood deaths recorded from 2015 to 2025 were in Texas, 31%; West Virginia has the highest rate at 18.6 per million residents (source: NOAA NCEI Storm Events; report: Flash flood deaths by state).
| Water depth | Median building damage, FEMA NFIP | Claims |
|---|---|---|
| Under 1 foot | $18,842 | 113,601 |
| 1 to under 2 feet | $41,296 | 148,318 |
| 2 to under 3 feet | $63,020 | 60,260 |
| 3 to under 4 feet | $68,621 | 30,627 |
| 4 to under 5 feet | $71,906 | 17,844 |
| 5 to under 6 feet | $68,449 | 10,364 |
| 6 to under 7 feet | $53,651 | 7,392 |
Read the depth figures as a curve, not a price list. The first two feet reach flooring, the bottom of every wall, lower insulation and floor-level contents, which is where most of the restoration scope is decided. Above that the median flattens, and beyond about six feet the claims thin out and the mix of buildings changes, so the deeper bands say more about which buildings flood deeply than about water.
Insurance gaps: who is covered and what gets paid
Insurance statistics answer two different questions, and they are easy to confuse. Take-up asks how many homes hold a policy at all. Payout asks what a policy pays once a claim is made. Both are measured here only for flood, because the NFIP is the one programme that publishes the data; private homeowners claim files are not public.
- 2.89% of US residential structures carry an NFIP flood policy: 3,160,864 policies against 109,326,879 structures, and the median county is 0.44% (source: FEMA OpenFEMA, as of 3 August 2026; report: The flood insurance take-up map).
- 43.9% take-up inside FEMA’s mapped flood zone, against 1.25% outside it, where 96.1% of homes sit; Louisiana is highest at 22.0% (source: FEMA OpenFEMA; report: The flood insurance take-up map).
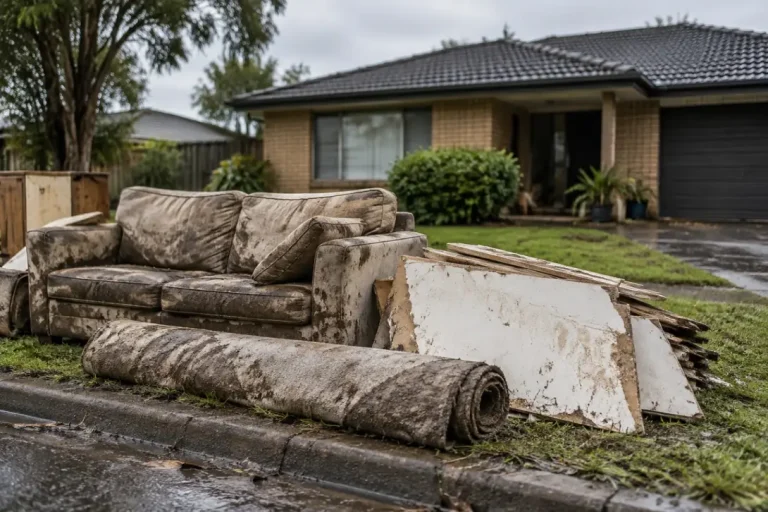
- 9.8% of 6,367,334 FEMA registrations in eight large disasters reported flood insurance, and 73.7% of inspected owner homes with water inside had no flood policy (source: FEMA OpenFEMA; report: The disaster insurance gap report).
- 95.8% the median NFIP building payout as a share of assessed damage, with 34.1% of claims settling below 90% (source: FEMA OpenFEMA NFIP claims; report: The insured flood loss gap).
- 94.3% of NFIP claims assessed above the $250,000 residential building limit settle at or within $1,000 of it, and only 35.2% of claims record any contents payment (source: FEMA OpenFEMA NFIP claims; report: The insured flood loss gap).
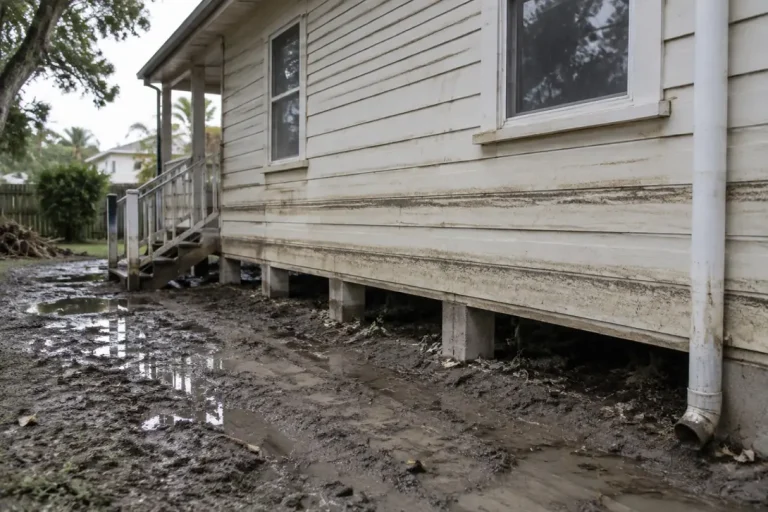
- 56.4% of FEMA’s 240,651 repetitive loss properties are not insured by the NFIP today, and 98.5% of severe repetitive loss buildings are not recorded as mitigated (source: FEMA OpenFEMA, as of 2 August 2026; report: Repetitive loss properties).
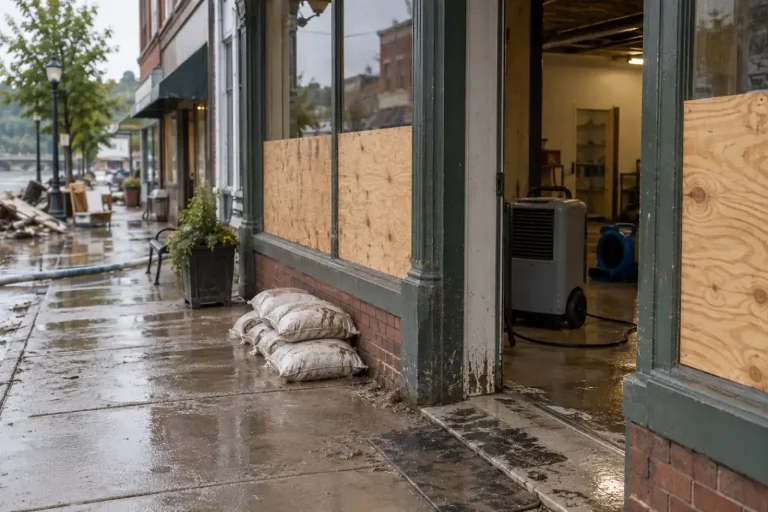
- 47.7% approved SBA disaster home loan dollars as a share of verified home loss, $14.9bn against $31.3bn for FY2015 to FY2022; contents are 24.8% of that verified loss (source: data from the SBA Disaster Loan Data files; report: SBA disaster loan statistics).
- $1,022 a year is the median NFIP bill for a single-family primary home, from $367 in Alaska to $1,467 in Connecticut, with $1,101 inside the high-risk zones against $925 outside them (source: FEMA OpenFEMA, policies in force 31 March 2026; report: Flood insurance cost by state).
The gap between those numbers is the story. Inside the mapped zone, where lenders generally require cover, close to half of homes are insured. Outside it, where almost all homes sit, the rate is close to zero, and yet a large share of flood claims still comes from there. The insurance and claims hub explains what that means for an owner making a claim.
Disasters and federal money
Federal disaster records measure the large end of water damage: events big enough to be declared, and the money that follows. They are the right source for when and where catastrophic work arrives, and the wrong one for everyday leaks, which never reach a declaration.
- 403 billion-dollar US weather and climate disasters from 1980 to 2024, costing $2,917.6 billion CPI-adjusted; the rate ran at 23.0 a year in 2020 to 2024 against 3.3 in the 1980s (source: NOAA NCEI; report: The billion-dollar disaster record).
- 50% of NOAA billion-dollar events are severe storms, while tropical cyclones carry 53% of the cost (source: NOAA NCEI; report: The billion-dollar disaster record).
- 5.7x the swing between the busiest month, August (244 disasters), and the quietest, November (43), across 1,422 restoration-relevant FEMA disasters since 2015 (source: FEMA OpenFEMA; report: The restoration seasonality calendar).
- 58 days the median gap between the start of an incident and a major disaster declaration, against 1 day for fire management grants (source: FEMA OpenFEMA; report: The disaster declaration lag).
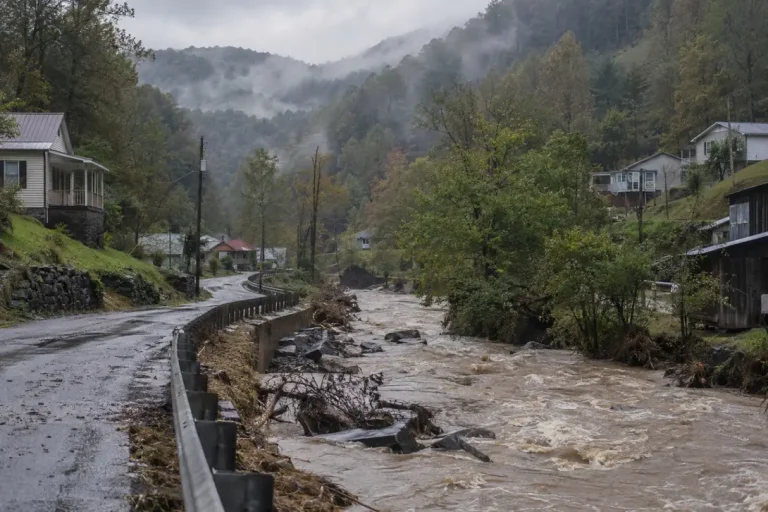
- 19 major disaster declarations naming Owsley County, Kentucky since 2015, the most of any county; 34 of the 71 counties with 10 or more are in Kentucky (source: FEMA OpenFEMA; report: The most-declared counties).
- 16,135 distinct county-level restoration events from federal disaster declarations, 2015 to 2025, led by Texas, Florida and Kentucky (source: FEMA OpenFEMA; report: The restoration demand index).
- 3.3x the range in demand volatility across high-volume states, from a coefficient of variation of 0.46 in Washington to 1.53 in Virginia (source: FEMA county declarations, 2015 to 2025; report: The demand volatility index).
- $243.7 billion in non-COVID FEMA disaster aid across declarations from 1998 to 2026; COVID-19 adds $97.9 billion, 33.9% of all Public Assistance (source: FEMA OpenFEMA; report: FEMA spending by state).
- $3,331 the mean approved FEMA housing grant across 12,036,730 approvals; 83.0% fall under $10,000 and 0.80% reach the statutory maximum (source: FEMA OpenFEMA; report: The disaster grant ledger).
- 68.3% of owner-occupied FEMA housing inspections record damage between $1 and $10,000, against 2.6% above $30,000 (source: FEMA OpenFEMA; report: The restoration job size distribution).
- 31.0% of renter assistance dollars go to rental assistance, against 16.2% for owners, while approval rates sit close at 46.8% for owners and 45.9% for renters (source: FEMA OpenFEMA; report: The owner and renter damage gap).
- 55,805 properties bought out with FEMA hazard mitigation grants since program year 1989, for $4.28 billion in federal share (source: FEMA OpenFEMA HMA Projects v4; report: FEMA buyouts by state).
Two cautions apply to the disaster series. The NOAA count is in CPI-adjusted dollars against a fixed $1 billion threshold, so more events cross it as more property sits in harm’s way, and the series has ended. And FEMA declaration counts measure declared events rather than job value: a single hurricane can name dozens of counties, which is why the seasonality report shows the peak moving from August to September when it counts counties instead of disasters.
Storms, freezes and fire
Flood is only one route to water and smoke damage. Hurricanes, tornadoes, hard freezes and wildfires each leave their own record, and each record has its own blind spots: NOAA’s Storm Events database logs reported property damage by event type, but many rows carry no estimate at all, so the totals below are floors rather than measures. The reports set those gaps out state by state.
- 47% of the $81.5 billion in US hurricane, tropical storm and storm surge damage in NOAA records for 2015 to 2025 was recorded in Florida, and Louisiana logged the most per resident at $5,799 (source: NOAA NCEI, Census Vintage 2025; report: Hurricane damage by state).
- $2.34 billion of reported tornado property damage in Texas from 2015 to 2025, the most of any state, while Kentucky recorded the most tornado deaths at 98 (source: NOAA NCEI; report: Tornado damage by state).
- 63% of the $30.2 billion in US wildfire property damage recorded by NOAA from 2015 to 2025 was in California, and one Camp Fire record holds 56% of the national total (source: NOAA NCEI Storm Events; report: Wildfire damage by state).
- 434,568 residential insurance claims came from the February 2021 Texas freeze, and 69.5% of FEMA-inspected homes in that disaster needed repairs to be habitable (source: Texas Department of Insurance report and FEMA OpenFEMA; report: Frozen pipe damage statistics).
The freeze figures show why no single dataset is enough. In the same Texas event, NOAA’s weather record captured 2.4% of the insured losses the Texas Department of Insurance reported, according to our frozen pipe report, which reads the insurance, FEMA and NOAA records side by side.
Workforce, firms and licensing
No official statistic counts the water damage restoration industry, because there is no single industry code for it. The closest federal series are NAICS 562910, which is environmental remediation, and the occupation of hazardous materials removal worker, which covers mold and abatement work. The figures below use them with that limit stated.
- $71,910 mean annual pay in New York for hazardous materials removal workers, against $31,960 in Puerto Rico; the employment-weighted national mean is $56,356 across 51,850 workers (source: BLS OEWS, May 2025; report: The restoration wage report).
- 9,387 private establishments and 96,727 employees in NAICS 562910 Remediation Services in 2026Q1, averaging 10.3 employees per establishment (source: BLS QCEW; report: The remediation establishment census).
- 0.78 declared disaster events a year per NAICS 562910 establishment in Kentucky, against 0.15 nationally (source: FEMA 2015 to 2025 and BLS QCEW 2026Q1; report: The restoration capacity index).
- 5 of 51 US jurisdictions issue a state occupational licence for mold work, and 42 have no programme at all (source: primary state statutes, per the report’s classification; report: The state mold licensing map).
- 58.6 mold licensees per 100,000 residents in New York, against 32.2 in Texas and 27.8 in Florida; 30.1% of New York’s contractor register is expired (source: data from the New York, Texas TDLR and Florida DBPR registers; report: Mold licensee density).
- 53 jurisdictions with an EPA-designated asbestos accreditation contact under AHERA, run by four different kinds of agency across the 22 states read (source: EPA AHERA and state agencies; report: The asbestos accreditation map).
| State | Mean annual wage, BLS OEWS | Workers |
|---|---|---|
| New York | $71,910 | 4,090 |
| Washington | $67,890 | 3,250 |
| Alaska | $67,850 | 140 |
| Idaho | $67,320 | 600 |
| New Hampshire | $66,500 | 140 |
| Illinois | $65,490 | 1,980 |
| New Jersey | $64,790 | 2,250 |
| Minnesota | $64,410 | 730 |
Treat these as bounds on the trade rather than a census of it. Water and fire restoration of buildings is scattered across construction and services codes, so the remediation counts understate the firms doing water work, and the wage series covers a related occupation rather than every technician. The running the business hub covers what those figures mean for a restoration firm.
Using and citing these figures
Data and tables in the research reports are released under CC BY 4.0. You can quote, chart and republish them with attribution to Remediation Insider and a link to the report the figure came from, not to this summary page. Each report carries a ready-made citation with its retrieval date.
When you quote a figure, keep its unit and its window with it. A share of FEMA registrations is not a share of disaster victims, a median NFIP claim is not the cost of water damage in general, and a rate from the 2023 housing survey describes the 12 months before each interview. Most misquoted statistics in this field lose exactly that context on the way.
Figures are recomputed when a source file is refreshed, and the report states the new retrieval date when that happens. If you find a figure that does not reproduce from the stated source and method, the corrections page explains how to report it and how fixes are logged.
Every research report
All the reports these statistics come from. The research index lists the same instruments with endpoints, queries and retrieval dates.
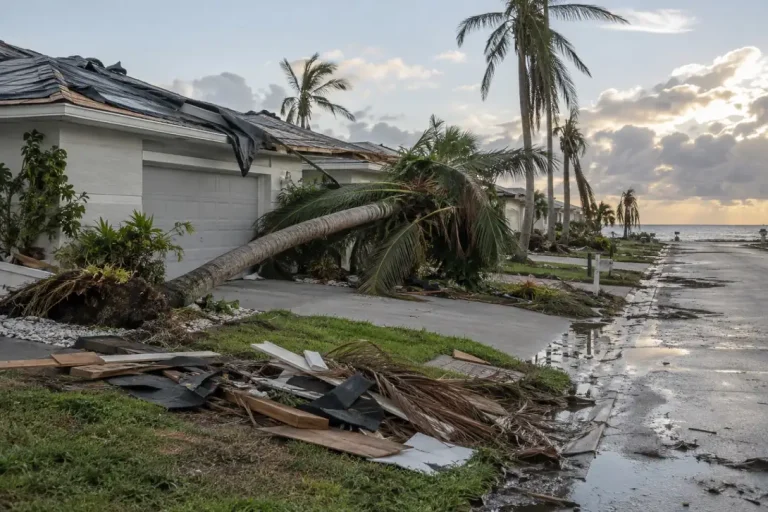 Hurricane Damage by State: NOAA Storm Records, 2015 to 2025NOAA Storm Events: hurricane, tropical storm and surge damage by state.
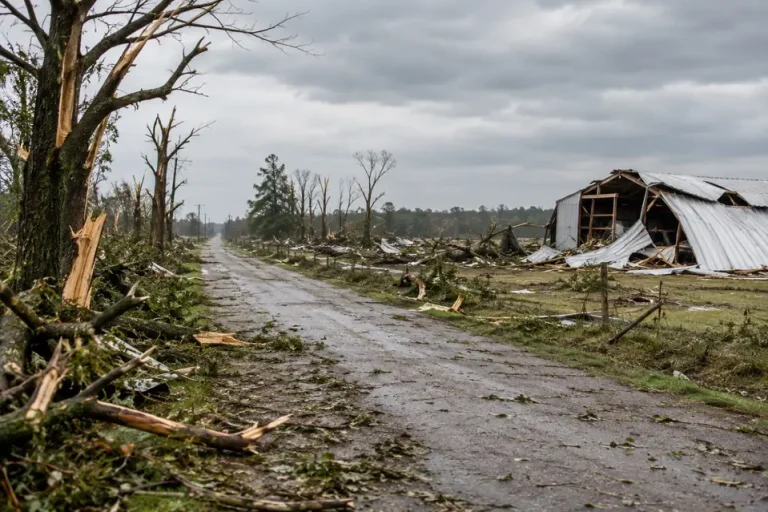 Tornado Damage by State: 14,271 Tornadoes in NOAA Records, 2015 to 2025NOAA Storm Events: tornado damage and deaths by state.
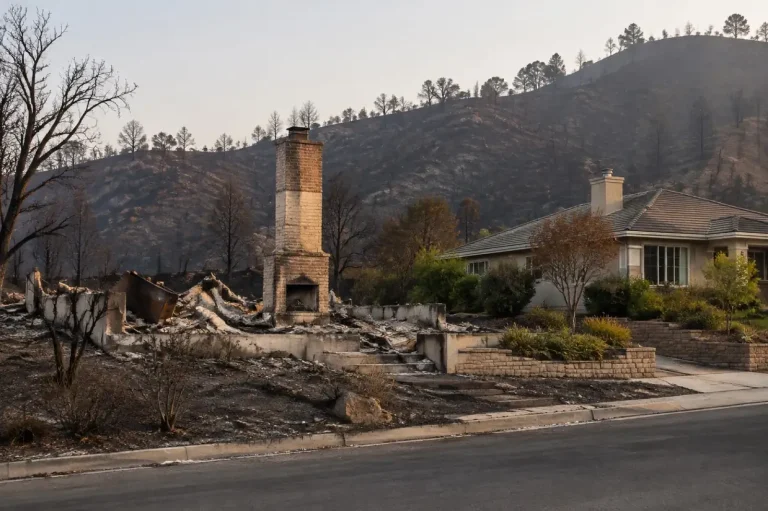 Wildfire Damage by State: NOAA and FEMA Records, 2015 to 2025NOAA and FEMA: recorded wildfire damage and FEMA fire aid by state.
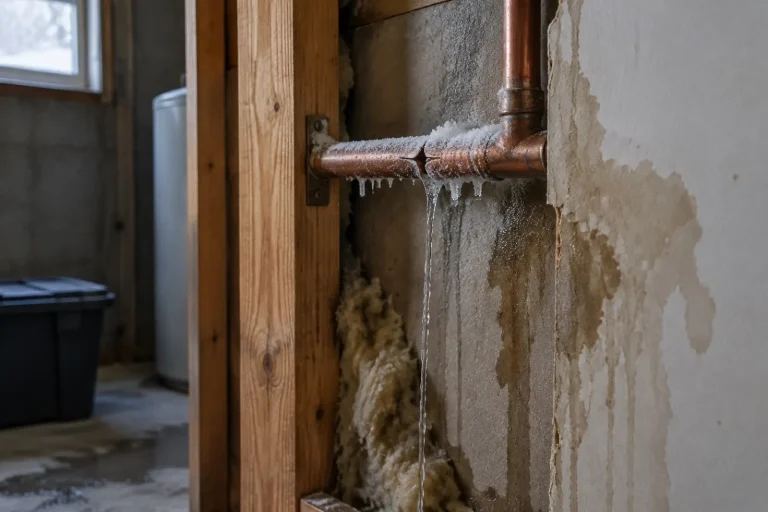 Frozen Pipe Damage Statistics: The 2021 Texas Freeze and US HomesTDI, FEMA, NOAA and Census: freeze losses read across insurance, FEMA and NOAA records.
 Flood Insurance Cost by State: 3.56 Million NFIP Policies PricedFEMA: what NFIP flood insurance costs, state by state and county by county.
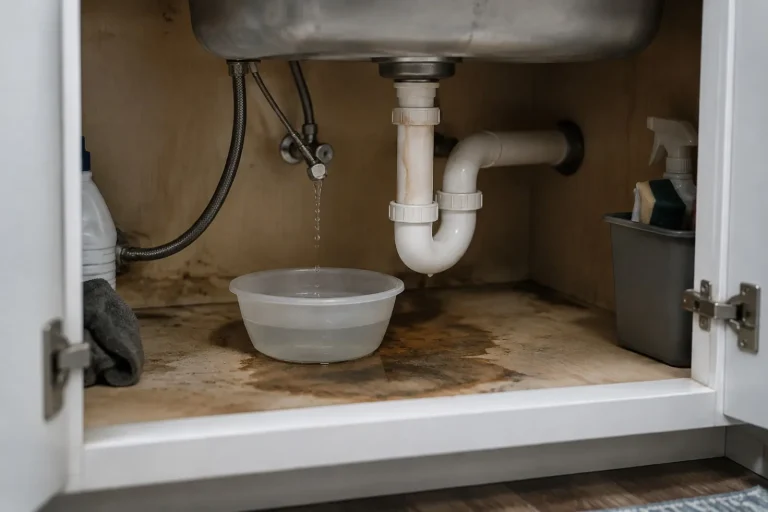 How Common Are Water Leaks in Homes? About 3 in 20 Homes a YearCensus American Housing Survey: how often US homes leak, and from where.
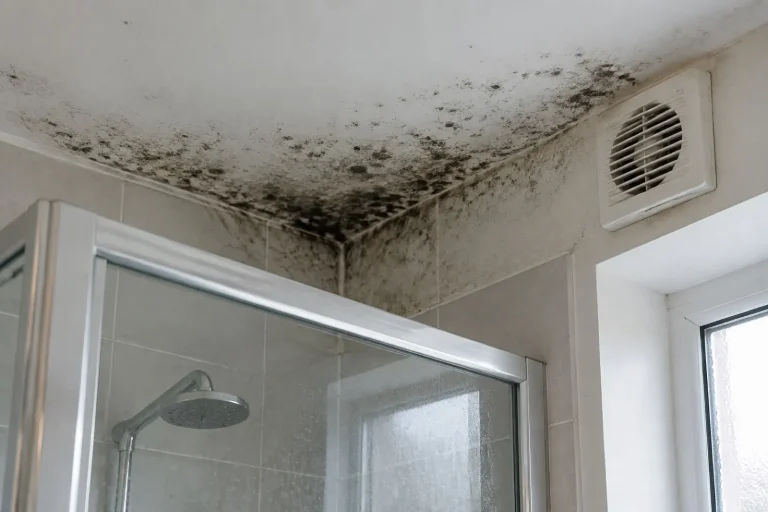 Percentage of Homes With Mold: What the American Housing Survey ShowsCensus AHS: how many homes report mold, by room, tenure and leak status.
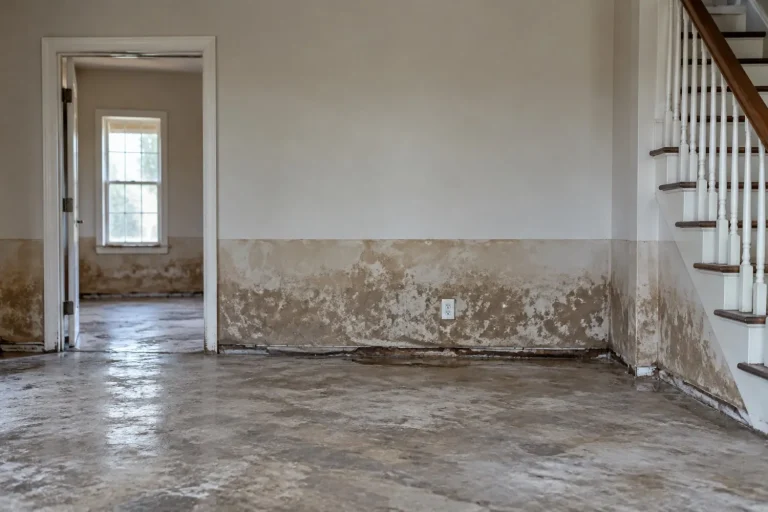 The Water Depth Damage Curve: 626,886 NFIP Claims AnalysedFEMA NFIP claims: median flood damage by foot of water.
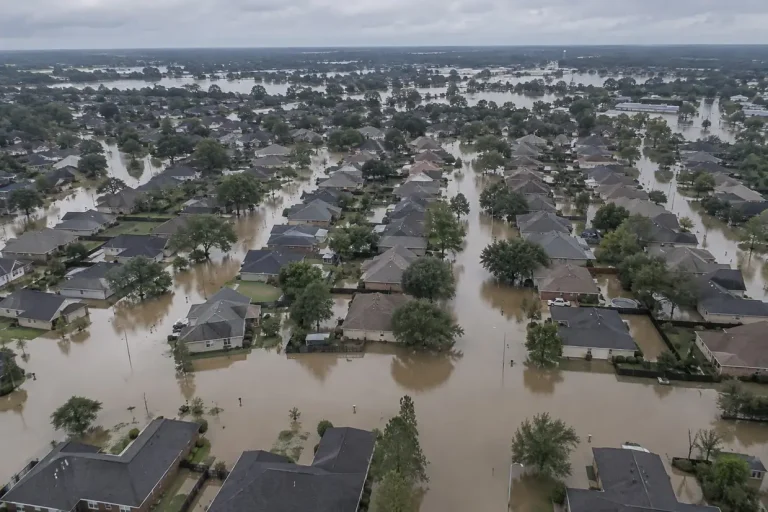 Flood Claims by State: Where Water Losses ConcentrateFEMA NFIP claims: where flood claims concentrate, by count and per head.
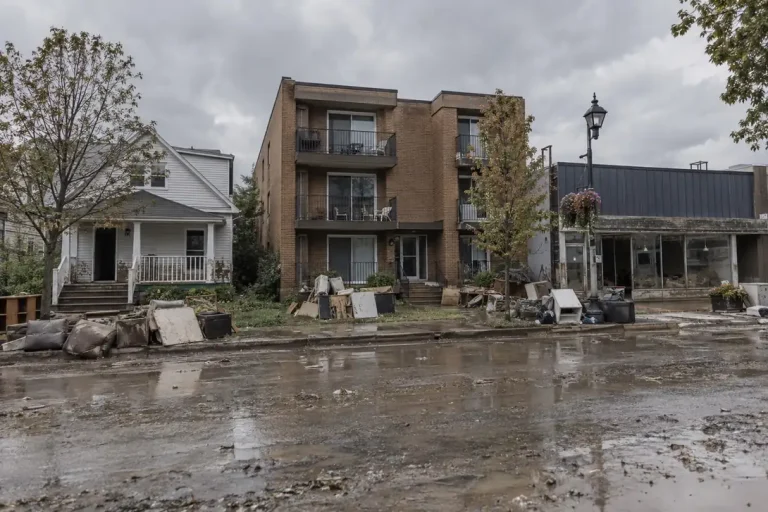 Flood Loss by Building Type: Homes, Rentals and CommercialFEMA NFIP claims: flood damage by occupancy type and flood zone.
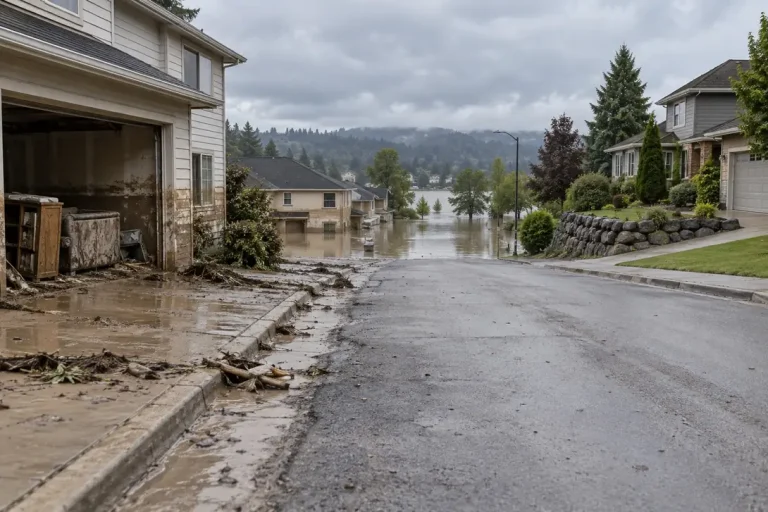 The Flood Zone Exposure Report: Claims Outside the Mapped RiskFEMA: how many flood claims come from outside the mapped high-risk zone.
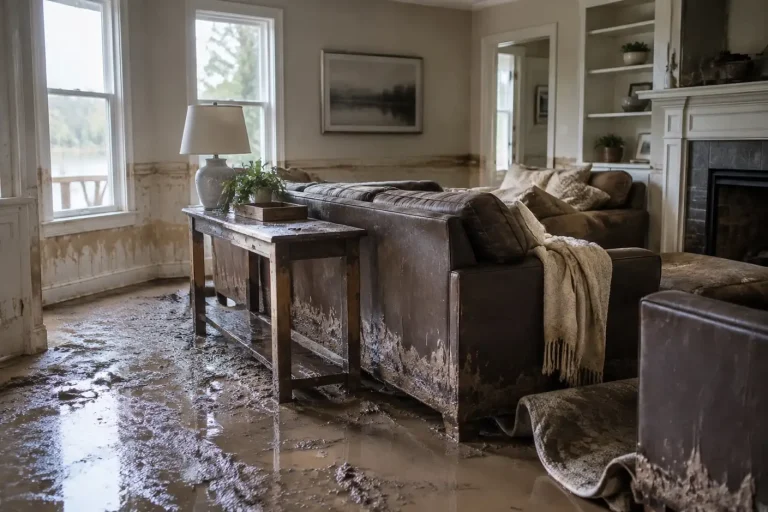 Inflation-Adjusted Flood Damage: A Decade of NFIP Claims in 2024 DollarsFEMA NFIP and BLS CPI-U: a decade of flood claims in constant dollars.
 The Contents Restoration Report: What Is Inside the BuildingFEMA NFIP claims: the size of the contents side of a flood loss.
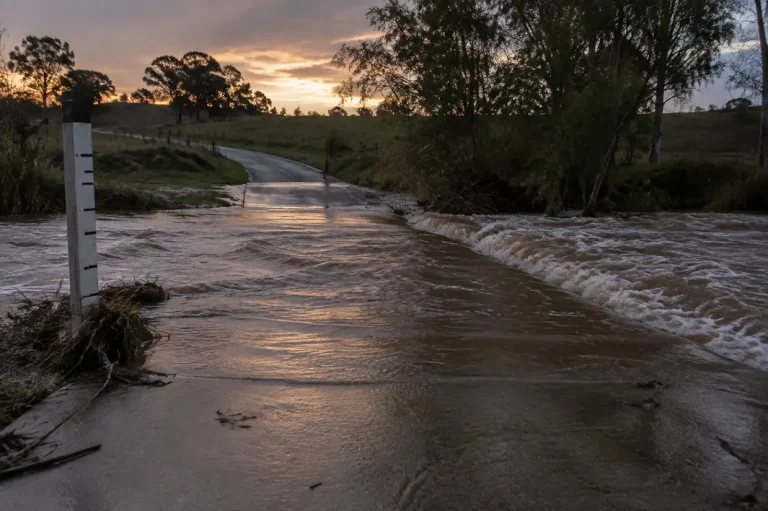 Flash Flood Deaths by State: 11 Years of NOAA Storm Event RecordsNOAA Storm Events: flash flood deaths by state and county.
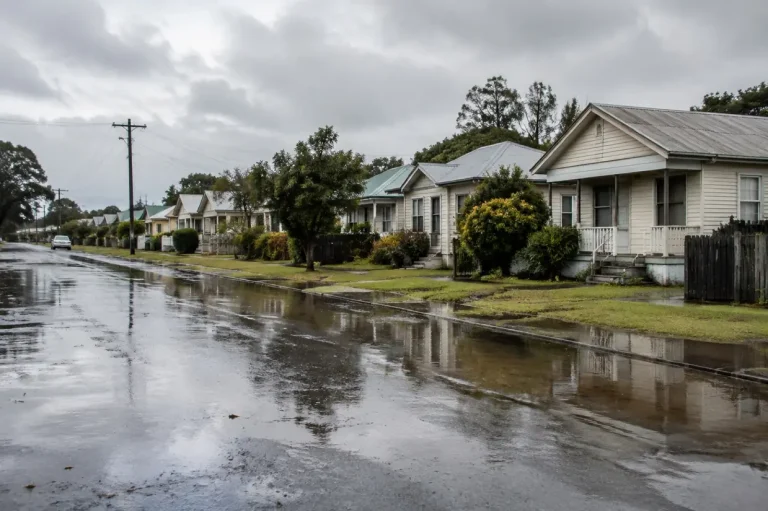 Percentage of Homes With Flood Insurance: The County Take-Up MapFEMA: the share of homes with flood insurance, county by county.
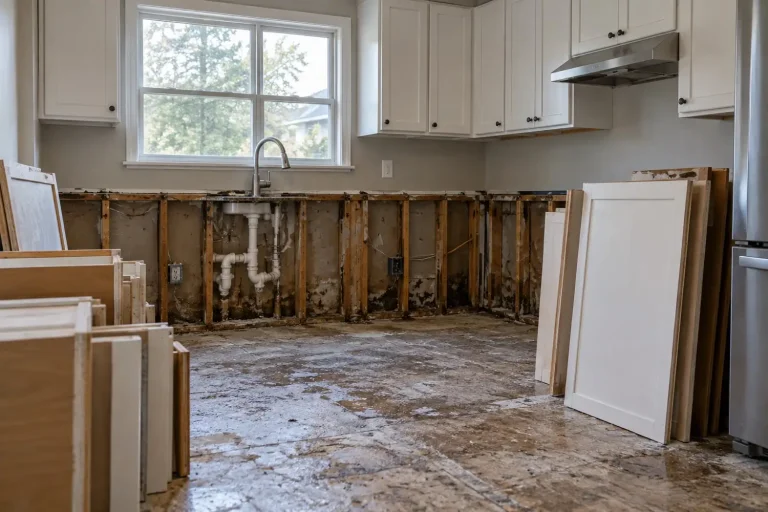 The Insured Flood Loss Gap: Claimed Against PaidFEMA NFIP claims: assessed flood damage against what the policy paid.
 How Many Disaster Victims Have Insurance? 6.37M FEMA RegistrantsFEMA: insurance held by disaster registrants in eight large disasters.
 Repetitive Loss Properties: 240,651 Buildings That Keep FloodingFEMA: the buildings that keep flooding, and whether they are insured.
 SBA Disaster Loan Statistics: Verified Losses Against Loans Approved, FY2015 to FY2022SBA Disaster Loan Data: verified disaster losses against SBA loans approved.
 The Billion-Dollar Disaster Record, 1980 to 2024, and Why It StoppedThe final NOAA billion-dollar disaster series, by type and decade.
 The Restoration Seasonality Calendar: When Disaster Work ArrivesFEMA: when disaster work arrives, month by month and state by state.
 The Disaster Declaration Lag: How Long Before Help Is DeclaredFEMA: days from incident to federal declaration, by programme.
 The Counties With the Most Disaster Declarations, 2015 to 2026FEMA: the counties named in the most major disaster declarations.
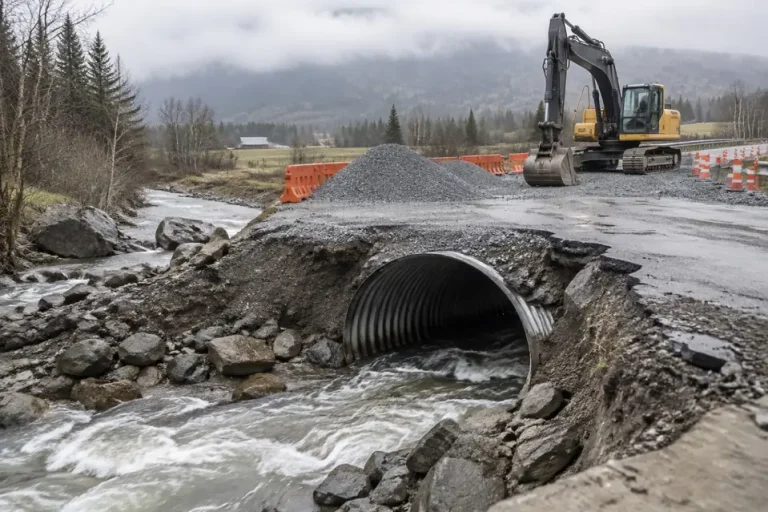 FEMA Spending by State: 1998 to 2026 Disaster Aid, RankedFEMA: fEMA disaster aid by state since 1998, with COVID-19 ranked apart.
 The Disaster Grant Ledger: What FEMA Assistance Actually PaysFEMA Housing Assistance: what FEMA Individual Assistance grants actually pay.
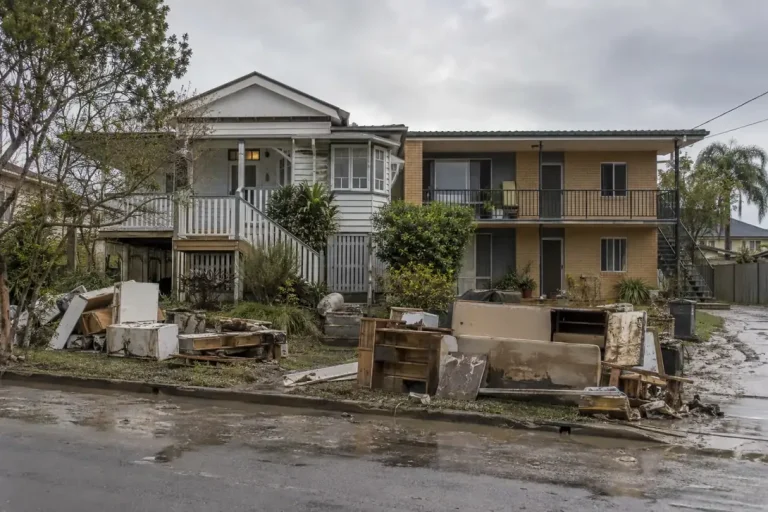 The Owner and Renter Damage Gap: Two Different DisastersFEMA Housing Assistance: how owner and renter disaster assistance differ.
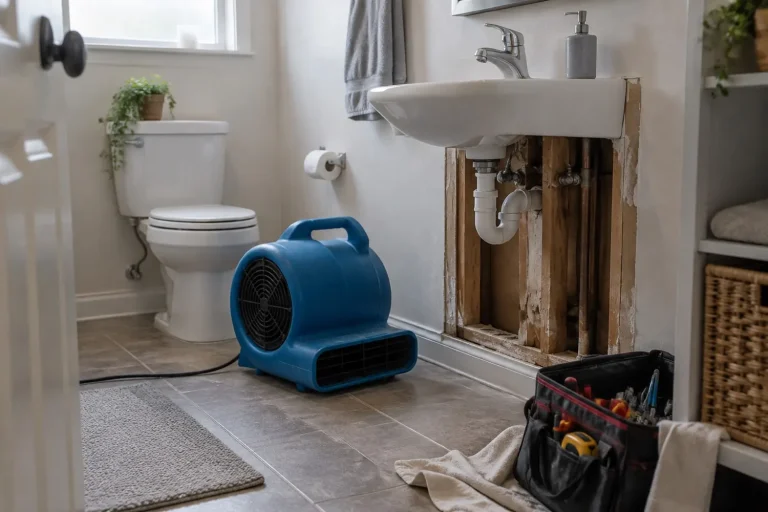 The Restoration Job Size Distribution: Where the Work Actually SitsFEMA inspections: where inspected disaster damage sits by size band.
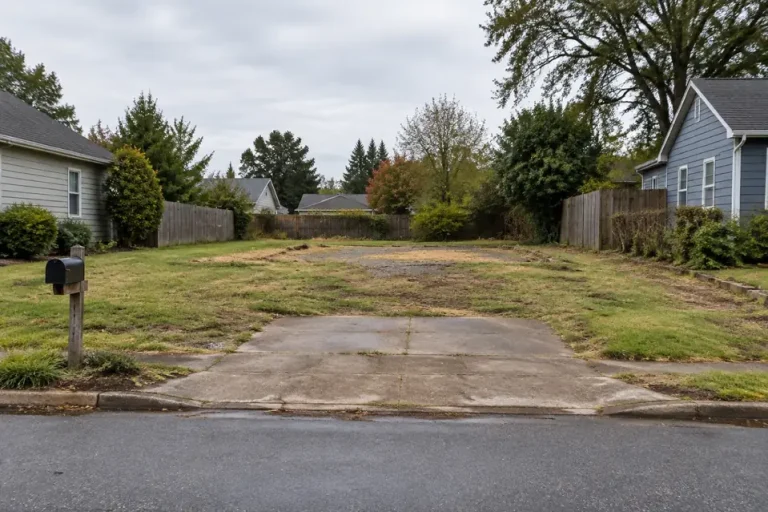 FEMA Buyouts by State: Where Hazard Mitigation Money Buys Out HomesFEMA HMA projects: where hazard mitigation money buys out homes.
 Restoration Demand Index 2026: 16,135 County EventsFEMA: county-level restoration events from federal disaster declarations.
 The Restoration Demand Volatility Index: Where Work Is SteadyFEMA: how predictable each state's disaster workload is.
 The Remediation Establishment Census: Firms and Employment by StateBLS QCEW: firms and employment in NAICS 562910 by state.
 The Restoration Wage Report: Hazmat Removal Pay in All 50 StatesBLS OEWS: hazardous materials removal pay in every state.
 The Restoration Capacity Index: Disaster Load per Firm by StateFEMA and BLS QCEW: declared disaster load per remediation firm.
 Mold Licensee Density: Texas, Florida and New York ComparedState registers: mold licensees per head in Texas, Florida and New York.
 The State Mold Licensing Map: What 50 States Actually RequirePrimary statutes: what each state actually requires for mold work.
 The Asbestos Accreditation Map: AHERA, Waivers and State RoutesEPA AHERA and state agencies: who runs asbestos accreditation in each state.
Related hubs
Questions people actually ask
How common is water damage in US homes?
In the 2023 Census American Housing Survey, 15.4% of occupied homes, about 20.5 million, reported a water leak from outside or inside in the previous 12 months. That counts leaks of any size, not insurance claims.
What percentage of homes have flood insurance?
FEMA data put NFIP policies on 2.89% of US residential structures as of 3 August 2026. Inside the mapped flood zone take-up is 43.9%, and outside it 1.25%, per FEMA OpenFEMA.
How much damage does a flood do to a house?
On NFIP claims filed since 2015, median building damage is $18,842 at under one foot of water and $63,020 at two feet, according to FEMA claims data. These are insured flood claims, so they exclude uninsured homes and non-flood water damage.
What percentage of homes have mold?
About 3.0% of occupied US homes, an estimated 3.9 million, reported mold at least the size of a sheet of letter paper in the previous 12 months, according to Census AHS 2023 data.
Are billion-dollar disasters becoming more common?
NOAA’s count of billion-dollar events rose from 3.3 a year in the 1980s to 23.0 a year in 2020 to 2024, in CPI-adjusted dollars. NOAA stopped updating the series in 2025, so 2024 is the last year it covers.
Can I use these water damage statistics?
Yes. The research data is released under CC BY 4.0, so you can reuse it with attribution to Remediation Insider and a link to the report the figure came from.
Why do these numbers differ from other water damage statistics?
Each figure here states its dataset, unit and time window, and different sources measure different things: a household survey counts leaks, the NFIP counts insured flood claims, and FEMA counts declared disasters. Figures without a named dataset cannot be compared at all.
Sources
- US Census Bureau, American Housing Survey 2023, national public use file v1.1.
- FEMA OpenFEMA datasets: NFIP Redacted Claims v3, NFIP Residential Penetration Rates v1, NFIP Multiple Loss Properties v1, Disaster Declarations Summaries v2, FEMA Web Disaster Summaries v1, Housing Assistance Owners and Renters v2, Individual Assistance Housing Registrants Large Disasters v1, Hazard Mitigation Assistance Projects v4. Retrieval dates are stated in each report.
- FEMA, NFIP Residential Penetration Rates v1.
- NOAA NCEI, Billion-Dollar Weather and Climate Disasters and NOAA NCEI Storm Events Database.
- US Small Business Administration, Disaster Loan Data, FY2015 to FY2022.
- BLS Occupational Employment and Wage Statistics, SOC 47-4041 and BLS Quarterly Census of Employment and Wages.
- BLS Consumer Price Index, CPI-U and US Census Bureau population estimates.
- State mold licence registers (Texas TDLR, Florida DBPR, New York Open Data), primary state statutes, and EPA AHERA accreditation contacts, as cited in the licensing reports.
This product uses the Federal Emergency Management Agency’s OpenFEMA API, but is not endorsed by FEMA. The Federal Government or FEMA cannot vouch for the data or analyses derived from these data after the data have been retrieved from the Agency’s website(s).
How this page is maintained. This hub summarises every research report by theme. The research index is the place for methods and reproduction details. Figures are recomputed from the research files each time the page is rebuilt, and it was last reviewed on 7 October 2026. Our standing rules for sources, retrieval dates and exclusions are on the methodology page. If anything here is wrong or out of date, the corrections page explains how to tell us and how fixes are logged.