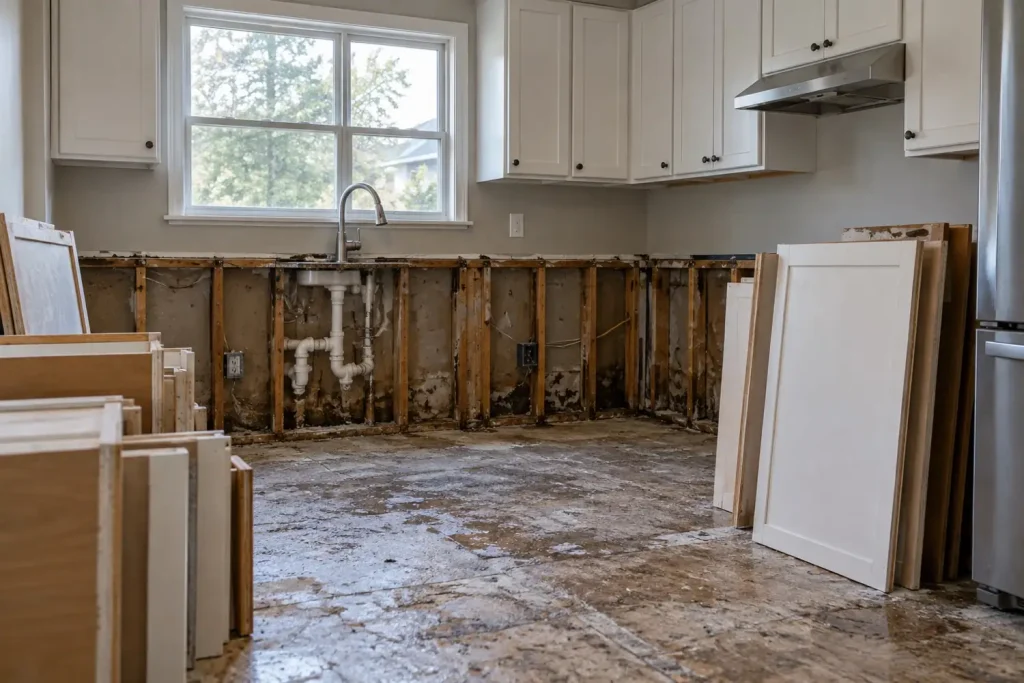
The finding
The insured flood loss gap is the difference between the damage assessed on a flood claim and the amount the policy pays out. Across 479,868 National Flood Insurance Program building claims with a loss year of 2015 or later, the median payout ratio is 95.8% of assessed damage, and 34.1% of claims settle below 90% of the assessed figure. A gap is not evidence of underpayment. Deductibles, the $250,000 residential building coverage limit, depreciation on actual cash value settlements and policy exclusions all produce one by design, and this report is a record of what the policy structure produces rather than a judgement on any claim.
Headline figures
In this report
- Read this before the numbers
- The payout ratio nationally
- The gap widens as the loss gets larger
- Where the gap is widest by state
- The building coverage limit
- Contents coverage is a separate problem
- Data quality and the cleaning applied
- Method
- Reproduce this
- What this does not show
- Questions this report answers
- Sources
Key findings
- The median NFIP building claim settles at 95.8% of assessed damage, computed across 479,868 claims with a loss year of 2015 or later.
- 26.7% of claims pay at or above the assessed damage figure, so the distribution is not a one-way shortfall.
- 34.1% of claims settle below 90% of assessed damage, 17.4% below 75%, and 7.0% below half.
- The ratio falls as the loss grows. Median payout is 73.4% in the $1,000 to $10,000 damage band against 96.9% in the above $250,000 band.
- 16,952 claims record assessed damage above the $250,000 residential building coverage limit, and 94.3% of those settle at or within $1,000 of the limit, which is the limit doing exactly what it is written to do.
- State median payout ratios run from 79.2% in Delaware to 98.2% in Texas across 44 states with at least 300 claims.
- Only 35.2% of claims in the file record any payment on a contents claim, because contents coverage is a separate purchase from building coverage under the NFIP.
- Where contents damage is recorded, the median contents payout ratio is 85.1%, below the 95.8% figure for buildings.
Read this before the numbers
A payout below assessed damage is the normal output of a flood policy, not a sign that something went wrong. Four structural features of NFIP coverage produce a gap on perfectly correctly handled claims.
- The deductible. Every NFIP policy carries one, and it is subtracted before payment. On a small loss the deductible is a large share of the claim, which is why the ratio is lowest in the smallest damage band.
- The coverage limit. NFIP building coverage for a residential structure tops out at $250,000. Assessed damage above that cannot be paid under the policy whatever the assessment says, per FEMA FloodSmart, NFIP types of coverage.
- Actual cash value settlements. Where a policy settles on an actual cash value basis rather than replacement cost, depreciation is deducted. FEMA FloodSmart, NFIP types of coverage states that contents are covered for their value at the time of the damage rather than their original cost, which is visible in the contents figures below.
- Exclusions. Basement finishings, detached structures, landscaping and certain personal property sit outside or are restricted under NFIP building coverage. Damage to them can be assessed and still fall outside what the policy pays.
Nothing here identifies an insurer, an adjuster or a claim, and nothing supports a conclusion that any claim was handled incorrectly. The dataset records no deductible, coverage limit, settlement basis or exclusion, so no individual gap can be attributed to a cause. What follows is a statistical record of the distance between two fields in a public dataset.
The payout ratio nationally
| Payout as a share of assessed damage | Claims | Share of claims |
|---|---|---|
| Below 50% | 33,544 | 7.0% |
| Below 75% | 83,313 | 17.4% |
| Below 90% | 163,699 | 34.1% |
| At or above 100% | 128,198 | 26.7% |
| Paid nothing | 7,779 | 1.6% |
The median claim settles at 95.8% of assessed damage and 26.7% of claims pay at or above the assessment, so this is a two-sided distribution rather than a systematic shortfall. The tail matters more than the median: 7.0% of claims settle below half the assessed figure, and 1.6% pay nothing at all against a recorded damage amount, which is what a denied or below-deductible claim looks like in this file.
The gap widens as the loss gets larger
| Assessed building damage | Claims | Median payout ratio | Share settling below 90% |
|---|---|---|---|
| $1,000 to $10,000 | 108,353 | 73.4% | 86.3% |
| $10,000 to $25,000 | 88,332 | 91.8% | 38.5% |
| $25,000 to $50,000 | 75,635 | 96.5% | 20.1% |
| $50,000 to $100,000 | 107,535 | 98.4% | 10.1% |
| $100,000 to $250,000 | 83,034 | 99.2% | 6.3% |
| Above $250,000 | 16,979 | 96.9% | 28.5% |
The shape here has a clean structural reading at both ends. In the $1,000 to $10,000 band the median ratio is 73.4%, because a fixed deductible is a large proportion of a small loss. In the above $250,000 band it falls to 96.9%, because the $250,000 building limit truncates the payment. The middle bands sit highest. Depth is part of the same story: our report on the water depth damage curve shows median damage rising steeply through the first two feet, which is the range where the deductible still bites hardest.
| Water depth | Claims | Median payout ratio |
|---|---|---|
| 0 ft | 104,033 | 93.7% |
| 1 ft | 142,765 | 96.8% |
| 2 ft | 58,860 | 97.1% |
| 3 ft | 29,933 | 96.9% |
| 4 ft | 17,445 | 96.8% |
| 5 ft | 10,099 | 96.4% |
| 6 ft | 7,133 | 96.2% |
| 7 ft | 4,761 | 96.4% |
| 8 ft | 4,391 | 96.2% |
| 9 ft | 2,694 | 96.7% |
| 10 ft | 2,620 | 96.6% |
Where the gap is widest by state
| State | Claims | Median payout ratio | Share below 90% | Share paying in full or above |
|---|---|---|---|---|
| Delaware | 457 | 79.2% | 73.7% | 7.9% |
| Colorado | 407 | 81.0% | 69.3% | 11.1% |
| Rhode Island | 383 | 83.3% | 63.7% | 7.8% |
| Illinois | 4,190 | 85.8% | 58.6% | 17.8% |
| Massachusetts | 2,939 | 86.8% | 57.3% | 10.4% |
| Ohio | 2,491 | 87.6% | 55.8% | 15.3% |
| New Hampshire | 559 | 87.6% | 54.9% | 11.3% |
| Connecticut | 1,525 | 87.8% | 54.7% | 14.5% |
| West Virginia | 2,614 | 87.9% | 55.8% | 12.9% |
| Maryland | 2,126 | 87.9% | 55.4% | 16.2% |
The spread between Delaware at 79.2% and Texas at 98.2% is wide, and the dataset does not say why. Three explanations fit and none can be separated out here. Low-ratio states tend to carry a higher share of small claims, where the deductible dominates. They also tend to have older housing stock with basements, where NFIP coverage of below-grade finishings is limited by policy language rather than by assessment. And the mix of residential against commercial policies differs by state, which changes the applicable limits. Our report on flood loss by building type sets out that mix.
The building coverage limit
The clearest single driver of the gap is a number written into the programme. NFIP building coverage for a one-to-four family residential structure is capped at $250,000. 16,952 claims in this sample record assessed damage above that figure.
94.3% of those claims settle at or within $1,000 of the limit. That is the limit working as written. The practical consequence is that assessed damage above $250,000 needs private excess flood cover or is self-funded, and on a large residential flood loss the insurance payment is a known ceiling rather than a negotiable figure.
Contents coverage is a separate problem
Building and contents are two separate NFIP purchases. A policyholder can hold building coverage and no contents coverage at all, and most appear to. Only 35.2% of the 626,886 claims retrieved record any payment on a contents claim, against 39.4% that record contents damage.
| Measure | Claims | Share of all claims retrieved |
|---|---|---|
| Contents damage recorded | 247,023 | 39.4% |
| Any amount paid on a contents claim | 220,377 | 35.2% |
| Contents damage of at least $1,000 with a paid figure recorded | 224,430 | 35.8% |
| Contents damage recorded but nothing paid | 9,416 | 1.5% |
Where both a contents damage amount and a contents payment are recorded, the median contents payout ratio is 85.1%, below the 95.8% figure for buildings. The structural reading is depreciation: contents are generally settled on an actual cash value basis, so a five-year-old sofa is paid at five-year-old value rather than replacement cost. That is written into the policy form and applies before any question of how a claim was handled. Our contents restoration report measures how much of a flood loss sits in the contents.
Data quality and the cleaning applied
| Issue | Claims affected | How we handled it |
|---|---|---|
| No usable damage and paid pair | 133,185 | Excluded. A payout ratio needs both a non-zero assessed damage amount and a recorded paid amount. |
| Assessed damage below $1,000 | 13,833 | Excluded. Values of a few dollars produce payout ratios in the thousands and distort every mean. The lowest observed damage values behave like placeholders rather than assessments. |
| Water depth recorded as exactly 99 | 13,551 | Excluded from the depth table. This is a sentinel value, not a measurement. |
| Negative water depth | 17,085 | Excluded from the depth table. The dataset uses negative values for water below the first floor. |
| Water depth above 20 feet | 30,953 | Excluded from the depth table. The field runs to several hundred feet, which is not plausible. |
The exclusion of very small damage amounts matters. Left in, the mean payout ratio across the file runs into the hundreds, driven by claims recording one dollar of assessed damage against a five-figure payment. After cleaning, the mean is 93.3% against a median of 95.8%, which is a sane distribution. Medians are used throughout for the same reason.
Method
How we counted. We retrieved 626,886 NFIP redacted claim records with a loss year of 2015 or later from the FEMA OpenFEMA API on 4 October 2026. For each claim we divided amountPaidOnBuildingClaim by buildingDamageAmount to give a payout ratio, keeping only claims with an assessed damage amount of at least $1,000 and a recorded paid amount, which leaves 479,868 claims. We then aggregated the ratio nationally and by damage band, state and cleaned water depth, reporting medians because the ratio distribution has a long right tail. States are ranked only where they carry at least 300 qualifying claims. Claims at the coverage limit are counted as those with assessed damage above $250,000 that settled at or above $249,000. The contents figures repeat the same calculation on amountPaidOnContentsClaim against contentsDamageAmount. No inflation adjustment is applied, so currency figures are nominal.
Reproduce this
Reproduce this
- Endpoint
https://www.fema.gov/api/open/v3/NfipClaims- Query
$filter=yearOfLoss ge 2015- Rows retrieved
- 626,886 rows
- Retrieved
- 4 October 2026
The API pages at 5,000 rows via $top and $skip. No API key is required. Re-running this query will return a larger set as newer claims are added.
What this does not show
What this does not show
- A gap is not evidence of underpayment. This is the most important limitation in the report. Deductibles, coverage limits, actual cash value settlement and policy exclusions all produce a gap on correctly handled claims, and the dataset carries none of those variables, so no individual gap can be attributed to any cause. Nothing here is an allegation against any insurer, any adjuster or FEMA.
- No deductible, limit or settlement basis is recorded. The file does not say what deductible applied, how much building or contents coverage was purchased, or whether the claim settled on replacement cost or actual cash value. Those are the three variables that would explain most of the variation shown here.
- These are insured flood losses only. NFIP covers policyholders. Uninsured flood damage is absent, and so is every water loss that is not a flood, including burst pipes, appliance failures and sewer backups outside a flood event.
- Damage amount is not restoration cost. The field records assessed damage on the claim, which is not what a contractor billed or what the work cost. A ratio of 100% does not mean the work was fully funded.
- No inflation adjustment. Figures spanning 2015 to 2026 are nominal dollars. The building coverage limit has not moved over that period while construction costs have, which mechanically pushes more claims against the cap in the later years.
- 2025 and 2026 are incomplete. Claims are filed and settled after the loss, so the most recent loss years undercount, and a claim retrieved before settlement can record damage with little or nothing yet paid.
Most quotable figures
- The median NFIP building claim settles at 95.8% of assessed damage, with 34.1% of claims below 90% (FEMA OpenFEMA, 2015 to 2026, n = 479,868).
- 94.3% of NFIP claims assessed above the $250,000 residential building limit settle at or within $1,000 of that limit (FEMA OpenFEMA, n = 16,952).
- Only 35.2% of NFIP claims filed since 2015 record any payment on a contents claim, because contents coverage is bought separately from building coverage (FEMA OpenFEMA).
- Median payout ratio falls from 73.4% on the smallest NFIP losses to 96.9% on losses above $250,000, which is the deductible at one end and the coverage limit at the other (FEMA OpenFEMA).
Questions this report answers
What is the insured flood loss gap?
It is the difference between the damage assessed on a flood insurance claim and the amount the policy pays. Across 479,868 NFIP building claims with a loss year of 2015 or later in FEMA data, the median payout is 95.8% of assessed damage.
Does a gap mean the claim was underpaid?
No, and this report should not be read that way. A deductible is subtracted from every NFIP claim, building coverage is capped at $250,000 for a residential structure, contents are generally settled at depreciated value, and several categories of damage sit outside the policy. All four produce a gap on a claim handled entirely correctly.
How much flood insurance can you buy?
Under the NFIP, building coverage for a one-to-four family residential structure is capped at $250,000, with contents coverage purchased separately. 16,952 claims since 2015 record assessed damage above that figure, and 94.3% of those settle at or near the limit in FEMA data. Cover above it has to come from a private excess flood policy.
Why is the payout ratio lowest on small claims?
Because the deductible is fixed and the loss is not. In the $1,000 to $10,000 damage band the median payout ratio is 73.4% in FEMA data, against 95.8% across all claims.
Why is the contents payout ratio lower than the building ratio?
Contents are generally settled on an actual cash value basis, which deducts depreciation, while building claims are more often settled on replacement cost. The median contents ratio in FEMA data is 85.1% against 95.8% for buildings.
Which states have the widest gap?
Among states with at least 300 claims, the lowest median payout ratio is 79.2% in Delaware and the highest is 98.2% in Texas, per FEMA data. The dataset does not record why, and claim size mix, housing stock and policy mix are all plausible contributors.
Can I reuse this data?
Yes. The tables and derived figures are released under CC BY 4.0 with attribution to Remediation Insider. The underlying claims data is public and available from FEMA.
How to cite
Remediation Insider. The Insured Flood Loss Gap: Claimed Against Paid. https://remediationinsider.com/insured-flood-loss-gap/ (retrieved 4 October 2026).
Data and tables in this report are released under CC BY 4.0. Attribution: Remediation Insider.
Sources
- Federal Emergency Management Agency. FEMA OpenFEMA NFIP Redacted Claims, v3. Claims with loss year 2015 or later. 626,886 records retrieved 4 October 2026.
- FEMA FloodSmart, NFIP types of coverage. Source for the $250,000 residential building coverage limit and the separation of building and contents coverage.
- FEMA OpenFEMA Terms and Conditions.
- No survey, interview or physical inspection was conducted for this report, and no claim file, insurer or adjuster was examined. Every figure is computed from the retrieved claims file.
This product uses the Federal Emergency Management Agency’s OpenFEMA API, but is not endorsed by FEMA. The Federal Government or FEMA cannot vouch for the data or analyses derived from these data after the data have been retrieved from the Agency’s website(s).