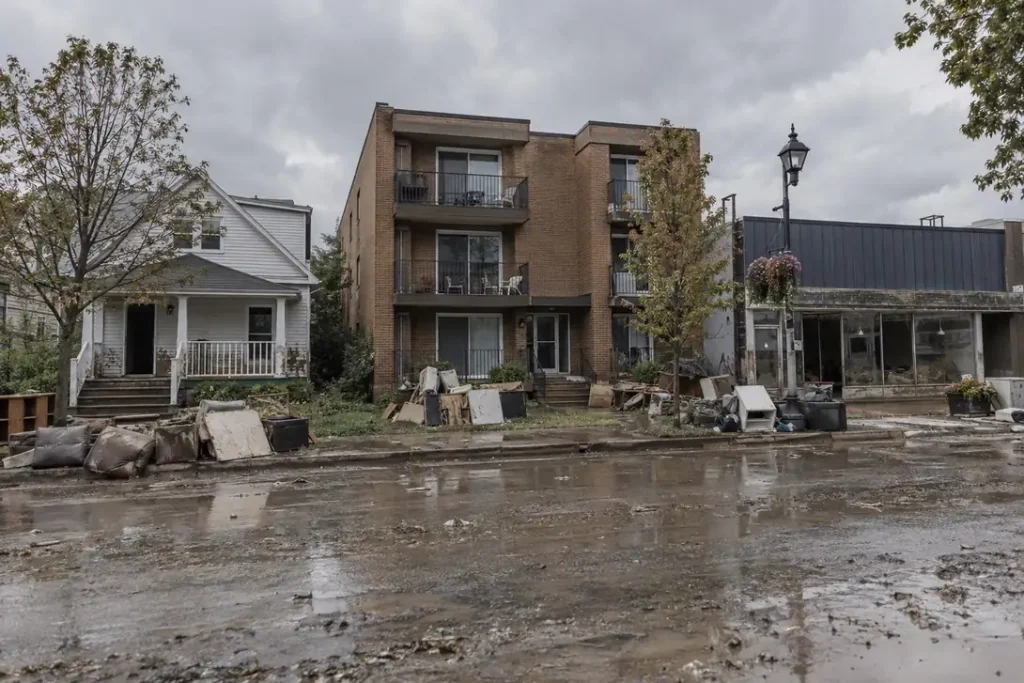
The finding
Flood loss by building type is not evenly distributed, and the two splits that matter most are both visible in the claims file. Across 491,398 National Flood Insurance Program building claims with a loss year of 2015 or later, median damage on a non-residential building is $45,124 against $35,792 on a residential one, a factor of 1.26 on medians and 1.65 on means. Separately, 26.4% of claims come from moderate and minimal risk flood zones rather than the mapped high-risk zones, so flood exposure does not stop at the line on the map.
Headline figures
In this report
Key findings
- Median building damage is $45,124 on a non-residential NFIP claim against $35,792 on a residential one, a ratio of 1.26 across 491,474 mapped claims since 2015.
- The gap is far wider on means than medians, $105,089 against $63,681, a factor of 1.65. Non-residential losses have a much longer right tail, which is where the largest single claims sit.
- The highest median damage of any occupancy code with at least 200 claims is $109,620 on residential non-condo building, 5 or more units (code 13).
- The lowest, among codes with at least 1,000 claims, is $16,971 on residential mobile or manufactured home (code 14), roughly 6.5 times below the top.
- 26.4% of claims with a usable rated flood zone come from B, C or X zones, which are the moderate and minimal risk designations, not from the mapped high-risk A and V zones.
- Median damage in those moderate-risk zones is $32,440 against $38,255 in high-risk zones, so claims from outside the Special Flood Hazard Area are 15% smaller at the median but not trivially so.
- Median recorded water depth is 1.0 feet in high-risk zones against 1.0 feet in moderate-risk zones, which accounts for part of the damage gap between them.
- Every occupancy code appearing on at least 200 claims in this sample maps to a definition in the published FEMA data dictionary, so no rows are reported as unmapped.
Residential against non-residential
Non-residential claims are a small minority of the file, 6.8% of mapped claims, and they are larger at both the median and the mean. The difference between those two ratios is the finding worth holding onto: 1.26 on medians, 1.65 on means. A typical commercial flood claim is only modestly bigger than a typical residential one, but the very large losses in this dataset are overwhelmingly commercial. That is a capacity question rather than an average-job question for anyone sizing a restoration operation. Our guide to commercial water damage restoration covers how scope and downtime change on those buildings.
Median payout ratios differ too, 96.1% on residential claims against 92.3% on non-residential ones. The structural reading is the coverage limit: per FEMA FloodSmart, NFIP types of coverage, NFIP residential building coverage caps at $250,000 while non-residential caps at $500,000, so the two building classes sit differently against their respective ceilings. Our report on the insured flood loss gap works through what the limits do to settlement.
Every occupancy code in the file
| Occupancy code | Class | Claims | Median damage | Mean damage | Median payout ratio | Median depth (ft) |
|---|---|---|---|---|---|---|
| 11: Single-family residential building | Residential | 259,069 | $37,332 | $59,606 | 96.4% | 1.0 |
| 1: Single family residence | Residential | 148,766 | $32,266 | $51,210 | 96.1% | 1.0 |
| 18: Non-residential building | Non-residential | 21,387 | $51,421 | $115,297 | 92.7% | 1.0 |
| 15: Residential condo association building | Residential | 15,593 | $70,067 | $226,333 | 97.7% | 1.0 |
| 12: Residential non-condo building, 2 to 4 units | Residential | 11,066 | $39,965 | $60,489 | 93.2% | 1.0 |
| 6: Non-residential business | Non-residential | 9,733 | $39,989 | $90,857 | 92.1% | 1.0 |
| 14: Residential mobile or manufactured home | Residential | 7,269 | $16,971 | $29,749 | 89.4% | 1.0 |
| 13: Residential non-condo building, 5 or more units | Residential | 5,088 | $109,620 | $175,508 | 95.1% | 1.0 |
| 2: Residential building, 2 to 4 units | Residential | 5,055 | $26,800 | $43,645 | 91.3% | 1.0 |
| 3: Residential building, more than 4 units | Residential | 4,123 | $63,434 | $123,603 | 94.2% | 1.0 |
| 4: Non-residential building | Non-residential | 2,311 | $23,106 | $73,115 | 88.6% | 1.0 |
| 16: Single residential unit in a multi-unit building | Residential | 1,938 | $21,460 | $33,840 | 92.3% | 1.0 |
The largest single pool is code 11, single-family residential building, with 259,069 claims at a median of $37,332. The single-digit and two-digit single-family categories both appear because the file spans the transition to Risk Rating 2.0, so a single-family house can arrive as a code 1 or a code 11 depending on when the policy was rated. We report them separately rather than merging them, because the two schemes define the category slightly differently: the Risk Rating 2.0 definition excludes mobile homes and units inside multi-unit buildings, which have their own codes. Our contents restoration report measures how much of each loss sits in contents rather than the structure.
The codes we will not label
Every occupancy code appearing on at least 200 claims in this sample maps to a published FEMA definition, so this report labels all 491,398 of them from the FEMA OpenFEMA NfipClaims data dictionary rather than inferring any category. Codes below that threshold are left out of the tables entirely rather than grouped into an unverified bucket. If a future retrieval introduces a code we cannot map, it will appear here as unmapped and be excluded from the residential split.
Flood risk does not stop at the zone line
The rated flood zone on a policy is the mapped risk designation for the property. A and V zones are Special Flood Hazard Areas, where flood insurance is mandatory for a federally backed mortgage. B, C and X zones are the moderate and minimal risk designations, where it is not. The common assumption is that claims come from the first group. 26.4% of them do not.
| Rated flood zone group | Claims | Share of claims | Median damage | Mean damage | Median payout ratio | Median depth (ft) |
|---|---|---|---|---|---|---|
| High risk, A and V zones | 359,798 | 73.6% | $38,255 | $70,597 | 95.0% | 1.0 |
| Moderate and minimal risk, B, C and X zones | 129,218 | 26.4% | $32,440 | $55,711 | 97.7% | 1.0 |
Roughly one claim in 4 comes from a zone where flood insurance was not required. Median damage there is $32,440, which is 15% below the $38,255 median in high-risk zones but not a different order of magnitude. Median recorded water depth is shallower outside the high-risk zones, 1.0 feet against 1.0 feet, which plausibly accounts for much of the damage difference on the evidence in our water depth damage curve report.
There is a selection effect to state plainly. These are claims, so every property in this table was insured. Properties outside a Special Flood Hazard Area are not required to carry flood cover, so the ones that do are a self-selected group, probably skewed towards owners who had already seen water. The share of claims coming from moderate-risk zones is therefore not the share of flood losses occurring there, and the true out-of-zone loss share is likely to be higher, because uninsured out-of-zone damage generates no claim at all.
Zone by zone
| Rated flood zone | Group | Claims | Median damage |
|---|---|---|---|
| AE | High risk, A and V zones | 303,064 | $41,842 |
| X | Moderate and minimal risk, B, C and X zones | 113,869 | $30,961 |
| A | High risk, A and V zones | 20,752 | $28,912 |
| VE | High risk, A and V zones | 12,887 | $20,361 |
| C | Moderate and minimal risk, B, C and X zones | 8,063 | $36,438 |
| B | Moderate and minimal risk, B, C and X zones | 7,286 | $48,918 |
| AH | High risk, A and V zones | 5,565 | $34,476 |
| AO | High risk, A and V zones | 2,622 | $22,355 |
| A07 | High risk, A and V zones | 1,517 | $14,064 |
| AHB | High risk, A and V zones | 1,261 | $34,021 |
The individual codes are worth reading rather than only the grouped totals, because the group medians hide real variation inside them. AE is the workhorse high-risk zone, a Special Flood Hazard Area with a published base flood elevation. X is the single largest moderate-risk code. Coastal V and VE zones carry the highest base flood elevations and the wave action requirement, yet their median building damage is not the highest in the table, which is a reminder that a zone designation describes probability and wave exposure rather than the size of any individual loss.
Data quality and the cleaning applied
| Issue | Claims affected | How we handled it |
|---|---|---|
| Building damage below $1,000 or absent | 135,411 | Excluded. Very low damage values behave like placeholders rather than assessments and distort every mean and payout ratio. |
| No occupancy code | 1 | Excluded from the occupancy tables, retained for the zone tables. |
| No classifiable rated flood zone | 2,322 | Excluded from the zone tables. This covers blank zones and codes that do not begin with A, V, B, C, X or D. |
| Water depth recorded as exactly 99 | 13,551 | Excluded from every depth column. This is a sentinel value, not a measurement. |
| Negative water depth | 17,085 | Excluded from every depth column. The dataset uses negative values for water below the first floor. |
| Water depth above 20 feet | 30,953 | Excluded from every depth column. The field runs to several hundred feet, which is not plausible. |
| No water depth recorded | 76,981 | Excluded from the depth columns only. |
Method
How we counted. We retrieved 626,886 NFIP redacted claim records with a loss year of 2015 or later from the FEMA OpenFEMA API on 4 October 2026. We kept claims with an assessed building damage amount of at least $1,000 and grouped them by occupancyType and separately by the first letter of ratedFloodZone. Occupancy labels come from the published FEMA data dictionary, and any code without an unambiguous published definition is reported as unmapped and excluded from the residential against non-residential comparison. Zone groups follow the FEMA definitions: A and V prefixes are Special Flood Hazard Areas, B, C and X are moderate or minimal risk, and D is undetermined and reported separately. For each group we computed the claim count, median and mean building damage, median payout ratio as amount paid divided by assessed damage, and median cleaned water depth. Medians are reported wherever a group holds at least 200 claims, because the damage distribution is right skewed. No inflation adjustment is applied, so currency figures are nominal.
Reproduce this
Reproduce this
- Endpoint
https://www.fema.gov/api/open/v3/NfipClaims- Query
$filter=yearOfLoss ge 2015- Rows retrieved
- 626,886 rows
- Retrieved
- 4 October 2026
The API pages at 5,000 rows via $top and $skip. No API key is required. Re-running this query will return a larger set as newer claims are added, and the two-digit Risk Rating 2.0 occupancy codes will take a growing share of it as legacy policies are re-rated.
What this does not show
What this does not show
- These are insured flood losses only. NFIP covers policyholders. Uninsured flood damage is absent, and so is every water loss that is not a flood, including burst pipes, appliance failures and sewer backups outside a flood event. The out-of-zone share is affected most by this, because out-of-zone properties are the least likely to carry flood cover.
- Damage amount is not restoration cost. The field records assessed damage on the claim, which is not what a contractor billed or what the work cost.
- Zone share is not loss share. Every property here was insured. Outside a Special Flood Hazard Area flood cover is optional, so the out-of-zone claims come from a self-selected group of owners and the figure understates where flood losses actually occur.
- The rated zone is the zone the policy was rated in. It is not necessarily the current mapped zone, and maps are revised. We use the rated zone because it is populated on more claims than the current zone field.
- Occupancy codes span two rating schemes. Legacy single-digit codes and Risk Rating 2.0 two-digit codes coexist in this file and define their categories slightly differently, so a like-for-like count of single-family claims over time is not available from this field alone.
- No inflation adjustment. Figures spanning 2015 to 2026 are nominal dollars.
- 2025 and 2026 are incomplete. Claims are filed and settled after the loss, so the most recent loss years undercount and will keep growing.
Most quotable figures
- Median NFIP building damage is $45,124 on a non-residential claim against $35,792 on a residential one, but on means the gap widens to $105,089 against $63,681 (FEMA OpenFEMA, 2015 to 2026).
- 26.4% of NFIP claims since 2015 come from moderate or minimal risk B, C and X flood zones rather than mapped high-risk A and V zones (FEMA OpenFEMA, n = 489,153).
- Median damage outside the high-risk zones is $32,440 against $38,255 inside them, and median recorded depth is 1.0 feet against 1.0 feet (FEMA OpenFEMA).
- The highest median damage of any NFIP occupancy category is $109,620 on residential non-condo building, 5 or more units, roughly 6.5 times residential mobile or manufactured home at $16,971 (FEMA OpenFEMA).
Questions this report answers
Do commercial buildings suffer worse flood damage than homes?
At the median, only modestly: $45,124 against $35,792 on NFIP claims since 2015 per FEMA data, a factor of 1.26. On means the gap is much wider, 1.65 times, because the largest individual losses in the dataset are overwhelmingly non-residential.
How many flood claims come from outside high-risk flood zones?
26.4% of NFIP claims with a classifiable rated zone and a loss year of 2015 or later come from B, C or X zones, the moderate and minimal risk designations, per FEMA data. That is roughly one claim in 4.
Does being outside a flood zone mean a property is safe?
No. Flood zones describe the probability of flooding and whether insurance is mandatory for a federally backed mortgage, not whether water can reach a building. Median damage on an out-of-zone NFIP claim is $32,440 in FEMA data, and the true out-of-zone loss share is likely higher than the claim share, because out-of-zone properties are the least likely to be insured.
What does occupancy type mean on an NFIP claim?
It is the code describing what kind of building the policy covers: single-family house, two-to-four unit building, condo association building, mobile home, non-residential structure and so on. Legacy single-digit codes and Risk Rating 2.0 two-digit codes both appear in current data, which is why the tables above list a code 1 and a code 11 single-family category separately.
Which building type has the highest median flood damage?
Residential non-condo building, 5 or more units (code 13), at $109,620 median assessed building damage across 5,088 claims in FEMA data since 2015.
Why do some codes appear as unmapped?
Because we only label a code where the published FEMA OpenFEMA NfipClaims data dictionary gives an unambiguous definition. Assigning a category to a code we cannot verify would move the residential split without any basis, so any such code is printed as unmapped and left out of that comparison.
Can I reuse this data?
Yes. The tables and derived figures are released under CC BY 4.0 with attribution to Remediation Insider. The underlying claims data is public and available from FEMA.
How to cite
Remediation Insider. Flood Loss by Building Type: Homes, Rentals and Commercial. https://remediationinsider.com/flood-loss-by-building-type/ (retrieved 4 October 2026).
Data and tables in this report are released under CC BY 4.0. Attribution: Remediation Insider.
Sources
- Federal Emergency Management Agency. FEMA OpenFEMA NFIP Redacted Claims, v3. Claims with loss year 2015 or later. 626,886 records retrieved 4 October 2026.
- FEMA OpenFEMA NfipClaims data dictionary. Source for every occupancyType label used in this report. Codes without an unambiguous published definition are reported as unmapped.
- FEMA flood zone definitions. Source for the grouping of A, V, B, C, X and D zone prefixes into high, moderate and undetermined risk.
- FEMA FloodSmart, NFIP types of coverage. Source for the $250,000 residential and $500,000 non-residential NFIP building coverage limits.
- FEMA OpenFEMA Terms and Conditions.
- No survey, interview or physical inspection was conducted for this report. Every figure is computed from the retrieved claims file.
This product uses the Federal Emergency Management Agency’s OpenFEMA API, but is not endorsed by FEMA. The Federal Government or FEMA cannot vouch for the data or analyses derived from these data after the data have been retrieved from the Agency’s website(s).