The short answer
Restoration costs split into two prices that are routinely merged: mitigation, which dries and stabilises the building, and reconstruction, which rebuilds it. According to our cost guides, which compile published 2026 price guides, water mitigation runs $3.00 to $12.00 per square foot and reconstruction roughly $20 to $37. Water category, containment and diagnosis move the number more than floor area does.
Start here
- Water damage restoration cost: the guide that explains mitigation against reconstruction and what sits inside a contractor rate.
- Mold remediation cost: why containment, not area, sets the floor on any mould job.
- The restoration job size distribution: FEMA data on how large declared-disaster losses really are.
Mitigation and reconstruction are two different prices
The first thing to settle on any restoration quote is which scope it covers. Mitigation is the emergency phase: extraction, drying equipment, monitoring, selective demolition, antimicrobial treatment and disposal. Reconstruction is putting the building back: drywall, insulation, flooring, trim, paint, cabinetry. According to our water damage restoration cost guide, which prices mitigation at $3.00 to $12.00 per square foot and reconstruction at roughly $20 to $37 per square foot, the figures are compiled from published contractor and aggregator price guides current in 2026. On those figures the two scopes differ by roughly five times per square foot.
That gap is the main reason restoration costs confuse people. A published average of a few thousand dollars is usually a mitigation number. An estimate that also rebuilds the room is a different scope, often by a different trade, starting only after drying is verified. When a quote and a published average disagree by a factor of five, check which scope each covers before assuming either is wrong. A competent quote states it in writing, as two figures.
Mitigation pricing behaves like time. Equipment bills per unit per day, so the drying clock is the largest single variable, and the count of units follows the drying class. Reconstruction pricing behaves like area and finish level: it tracks local construction labour, which is why it varies far more between markets than drying does.
The master cost table
Every cost guide on this site prices one job type, states its range in a fixed unit, and names where the range comes from. This table puts them side by side so the units and scopes can be compared honestly. Notice how many of the sources say the same thing: the ranges are compiled from published price guides and are indicative. We say that on every guide because it is true, and because most cost pages in this vertical do not publish a sample size or a collection date at all.
| Job type | Range, as our guide states it | Unit | What else the guide prices | Source the guide names |
|---|---|---|---|---|
| Water damage mitigation | $3.00 to $4.25 (clean water); $7.00 to $12.00 (contaminated) | per sq ft | Mitigation only; reconstruction is a separate scope at roughly $20 to $37 per sq ft | Compiled from published contractor and aggregator price guides current in 2026, keyed to ANSI/IICRC S500, 5th edition |
| Mold remediation | $10 to $25 (standard); $15 to $30 (hidden growth) | per sq ft | Plus a $500 to $1,500 minimum; whole structure $10,000 to $30,000 or more | Compiled from published contractor and aggregator price guides current in 2026; framework ANSI/IICRC S520, 4th edition |
| Sewage backup cleanup | $2,000 to $4,000 (small contained area); $7,000 to $14,000 (full finished basement) | per job | Mitigation at about $7 to $12 per sq ft, Category 3 | Compiled from published contractor and aggregator price guides current in 2026, keyed to ANSI/IICRC S500 categories |
| Asbestos removal | $1,200 to $3,000 (small localised); $15,000 to $30,000 or more (whole house or commercial) | per job | Floor tile and adhesive across a room $2,000 to $6,000; roughly $5 to $20 per sq ft | Compiled from published contractor, laboratory and aggregator price guides current in 2026; EPA NESHAP framework |
| Air duct cleaning | $450 to $1,500 (typical system); $1,000 to $3,000 (larger or multi-system) | per system | EPA does not recommend routine cleaning; three conditions where it may be appropriate | Compiled from published contractor and aggregator price guides current in 2026; EPA consumer guidance; NADCA ACR standard |
| Attic mold removal | $1,500 to $3,000 (small area); $6,000 to $10,000 or more (full attic with insulation) | per job | Ventilation correction adds roughly $500 to $2,500 | Compiled from published contractor and aggregator price guides current in 2026; ANSI/IICRC S520 and EPA guidance |
| Mold inspection | $300 to $1,000 (residential); $1,000 to $2,000 or more (large or complex) | per inspection | Laboratory fees often separate at roughly $30 to $75 per sample | Compiled from published inspector, laboratory and aggregator price guides current in 2026 |
| Basement waterproofing | $500 to $2,000 (interior sealant); $12,000 to $20,000 or more (exterior excavation and membrane) | per job | Interior drainage with sump $5,000 to $10,000; crack injection $400 to $900 per crack | Compiled from published contractor and aggregator price guides current in 2026 |
| Sump pump installation | $600 to $1,200 (replacement in existing basin); $2,500 to $5,000 (new install with slab cut) | per installation | Battery backup adds $900 to $2,000; water-powered backup $1,200 to $2,500 | Compiled from published contractor and aggregator price guides current in 2026 |
| French drain | $1,500 to $4,000 (yard drain); $10,000 to $20,000 or more (full exterior system) | per job | Per linear foot about $50 to $100 interior and $100 to $200 exterior | Compiled from published contractor and aggregator price guides current in 2026 |
| Crawl space encapsulation | $1,500 to $3,000 (vapour barrier only); $8,000 to $15,000 (full, with drainage and sump) | per job | With structural repair $12,000 to $30,000 | Compiled from published contractor and aggregator price guides current in 2026 |
| Burst pipe repair | $200 to $1,500 (plumbing repair); then $3.00 to $4.25 per sq ft (clean-water mitigation) | per repair, then per sq ft | Two bills: the plumber and the drying | Compiled from published plumbing contractor and aggregator price guides current in 2026; mitigation band from our water damage guide |
Two patterns stand out. Per-square-foot pricing belongs to the jobs where area is the work, such as drying and mould removal. Per-job tiers belong to the jobs where a decision is the work: which drainage method, how much of the attic, whether the material is friable. Comparing a per-square-foot figure from one guide with a per-job figure from another is the fastest way to misread restoration costs.
What moves a restoration price
Across the guides, three drivers recur, and floor area is not the strongest of them.
Contamination decides what is dried and what is removed
ANSI/IICRC S500 sorts water losses into three categories by contamination. Clean water lets most materials stay and dry. Category 3 water, including sewage and floodwater, means porous materials come out, with containment, PPE and disposal on top. That is why our sewage backup cleanup cost guide puts sewage at two to three times a clean-water loss of the same size, citing the S500 Category 3 definition, and why a burst pipe repair caught the same day costs less than the same pipe found after a weekend: clean water does not stay clean.
Containment is a fixed cost
Building a containment, running negative air and setting up decontamination costs roughly the same on a small area as a large one. Our mold remediation cost guide shows this as a minimum charge applied regardless of area, framed by ANSI/IICRC S520. The same logic drives the asbestos removal cost guide, where friability and access move the number more than square footage, under the EPA NESHAP work practice rules it cites.
Diagnosis chooses the method, and the method sets the tier
In the moisture-control jobs, the price follows the diagnosis. The basement waterproofing cost guide notes that a meaningful share of wet basements are fixed with gutters, downspout extensions and grading before any membrane is discussed. The french drain cost guide shows the interior against exterior decision moving the price more than linear footage. The crawl space encapsulation cost guide separates its tiers by scope rather than area, and the attic mold removal cost guide prices the ventilation correction separately because skipping it is why attics get remediated twice.
Time is a line item
Elapsed time changes restoration costs in two ways. The first is category drift: under the ANSI/IICRC S500 framework our guides describe, clean water degrades with time, warmth and contact with building materials, and water left standing for roughly three days is commonly treated as Category 3 whatever its source. A loss reported on Friday and attended on Monday is a different job with a different price. The second is the drying clock itself. Because equipment bills per unit per day, a job that dries in three days instead of five costs less in both equipment and monitoring, and a job demobilised early to save those days can return as a mould job behind new drywall, which EPA mould guidance ties back to uncontrolled moisture.
The practical consequence for anyone reading a quote is that speed and documentation are cost controls. Photographs before anything moves, a baseline moisture reading on unaffected material, and daily readings for every day equipment runs are what let an owner, an adjuster and a contractor agree on how long the job needed to take.
Where the job is
Location moves price through labour and through demand. Labour costs differ by state in the federal wage data covered below. Demand matters because a market where disaster work arrives in surges forces firms to carry spare capacity or rent it, and both show up in rates. Reconstruction varies by market far more than drying does, because it tracks local construction labour and finish level rather than equipment days.
Prevention work is priced differently from repair
Restoration repairs damage after it happens. A second group of jobs prevents the next loss, and those are priced as capital work rather than emergency response. The sump pump installation cost guide makes the comparison explicit: it reads pump and backup tiers against the cost of a sewage or groundwater event in a finished basement, which it carries over from our water damage guide. That is a fair frame for an owner deciding whether to spend now or risk spending later, and it is the only kind of comparison these compiled ranges support. They are not a forecast for any individual property.
Two other jobs sit on the boundary between prevention and diagnosis. A mold inspection buys a written finding, not a visit, and in states such as Florida the assessor and the remediator are licensed separately under Florida Statutes Chapter 468 so the person diagnosing is not the person paid to fix it. Air duct cleaning is the clearest case of a job that is often sold rather than needed: EPA consumer guidance does not recommend routine cleaning and names three conditions where it may be appropriate. After a fire, flood or construction work it is a different question.
How big restoration jobs actually are
Cost guides describe what a job costs once you have one. The other half of pricing is the distribution of jobs, and that is where federal data helps. FEMA inspects owner-occupied homes after declared disasters and records the inspected damage in fixed dollar bands. According to the FEMA housing assistance file, 68.3% of 7,974,241 owner-occupied inspections from 2002 to 2026 fall in the $1 to $10,000 band, and only 2.6% exceed $30,000. The full breakdown, including the state spread, is in our restoration job size distribution.
Two cautions keep this honest. FEMA inspected damage is an assistance assessment, not a contractor invoice, and it covers declared disasters only, so the burst pipes and appliance leaks that make up most everyday water work never enter the file. What it does show is shape: per the FEMA data, the average inspection recorded $5,003 of inspected damage, and the bottom band dwarfs everything above it. Read against the cost table above, that puts most declared-disaster losses in the same territory as a sewage cleanup or a single room of mitigation, not a whole-house rebuild.
Structure, contents and where the money sits
Restoration costs are usually quoted for the building. The contents inside it are a second bill that cost guides mostly leave out, and two federal files let it be sized. SBA loss verifiers split each damaged home into real estate and contents. According to SBA Disaster Loan Data for fiscal 2015 to 2022, contents make up 24.8% of verified home loss, $7.8bn of $31.3bn. Our SBA disaster loan statistics report sets out the method and the one outlier row it excludes.
| FEMA incident type | Verified home loss | Contents share | Approved loans as share of loss |
|---|---|---|---|
| Hurricane | $20.4bn | 24.4% | 53.3% |
| Fire | $3.8bn | 19.9% | 23.5% |
| Flood | $3.6bn | 35.4% | 50.0% |
The proportion moves with the hazard. According to the SBA data, flood disasters carry a 35.4% contents share against 19.9% for fire. The flood claims file tells a similar story from a different angle: according to our contents restoration report, the median NFIP claim records contents damage at 28.3% of building damage across 230,560 paired claims since 2015 (FEMA OpenFEMA NfipClaims v3, retrieved 4 October 2026). For an owner that is the pack-out, cleaning and replacement budget the structural quote does not show. For a contractor it is the scope a contents division prices separately.
Depth explains part of the building figure too. Per the NFIP claims data in our water depth damage curve, median building damage climbs steeply over the first two feet of water and then flattens, which is why a few inches of flood water already produce a reconstruction-sized number.
What a restoration rate is built from
A per-square-foot rate is a composite. Our water damage cost guide breaks it into four parts: burdened labour, equipment billed per unit per day, consumables and disposal, and overhead and profit. Each moves for a different reason. Labour moves with certification level and after-hours response. Equipment moves with drying duration. Consumables move with water category. Overhead and profit moves with whether the carrier accepts it on the file, which our restoration estimating hub covers in detail.
There is one public anchor for the labour part. BLS does not publish a restoration technician occupation, but its hazardous materials removal workers code covers cleaning mould-contaminated sites. Our restoration wage report computes an employment-weighted mean annual wage of $56,356 from the BLS state series (BLS OEWS May 2025, SOC 47-4041), running from $71,910 in New York down to $31,960 in Puerto Rico. Those are unburdened wages. Payroll tax, liability and workers compensation insurance, vehicles and unbilled standby sit on top before they become an employer cost, which is why a billed labour rate looks like a multiple of the wage.
| Rate component | What moves it | Where it shows on a quote |
|---|---|---|
| Labour | Certification, emergency response, crew size the drying class requires | Technician hours |
| Equipment | Days running, set by moisture readings | Air movers and dehumidifiers per unit per day |
| Consumables and disposal | Water category; Category 3 carries containment, PPE and tipping fees | Antimicrobial, sheeting, bagging, disposal |
| Overhead and profit | Genuine multi-trade coordination | A percentage applied at estimate level |
Why published averages disagree, and how to read a quote
Cost aggregators publish national averages for the same job that cluster suspiciously closely and still disagree. The usual reason is bundling: some quote mitigation only, some fold in partial rebuild, some blend commercial with residential, and few state when or how the figures were collected. Shared lineage between two sites is not independent confirmation.
Five questions turn a quote into something you can compare:
- Which scope is this: mitigation, reconstruction, contents, or all three? Ask for separate figures.
- Which water category and drying class is it written for? Those two values set what is removed and how much equipment is justified.
- How many units of equipment, for how many days, and where are the daily moisture readings that justify the count?
- What is excluded? The plumbing repair that caused the loss, specialty flooring and clearance testing are commonly outside a mitigation scope.
- Who is paying, and under what cover? Coverage turns on cause, and only the policy, the insurer and your state insurance department can settle what is paid.
Most insured restoration in the United States is priced through estimating software against regional price lists, so the dispute that follows is usually about scope and quantities rather than unit price. Our estimating hub and the guide to how Xactimate pricing works explain that side of the file.
Every cost guide in this section
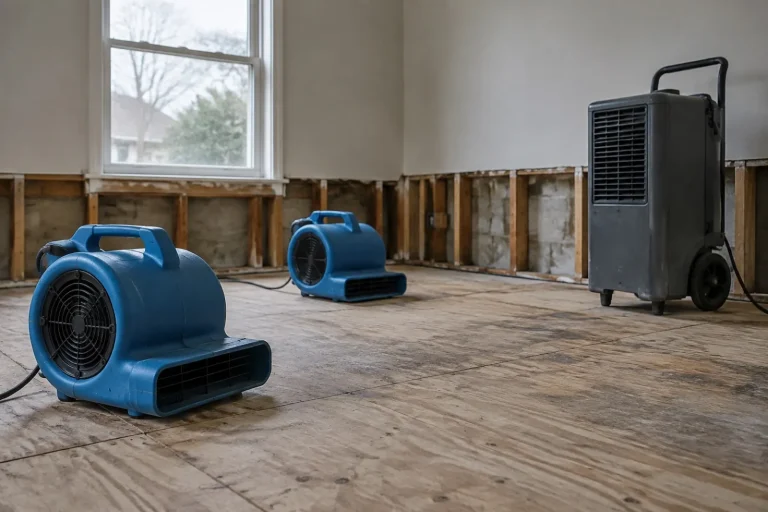 Water Damage Restoration Cost 2026: $3 to $12 per Square FootMitigation priced by water category, plus the contractor rate build-up.
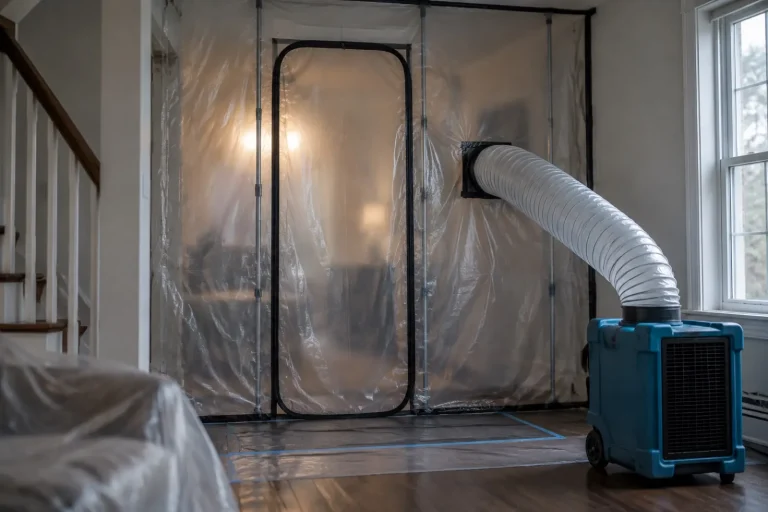 Mold Remediation Cost 2026: $10 to $30 per Square FootWhy containment, not floor area, sets the floor on a mold job.
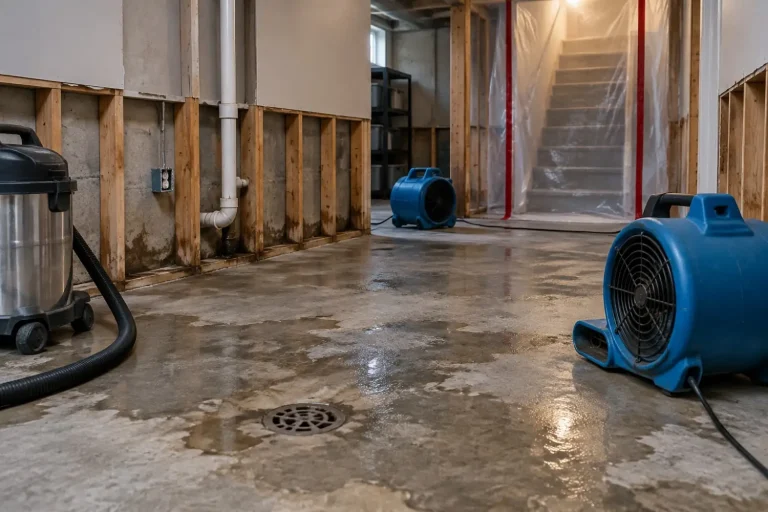 Sewage Backup Cleanup Cost 2026: $2,000 to $15,000Category 3 pricing, endorsements and who pays for the lateral.
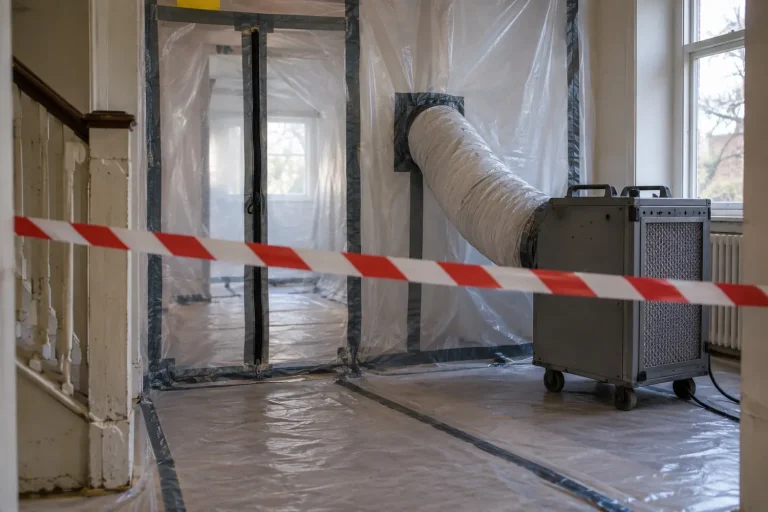 Asbestos Removal Cost 2026: $1,200 to $30,000 by ScopeFriability, access and the regulatory steps that set abatement cost.
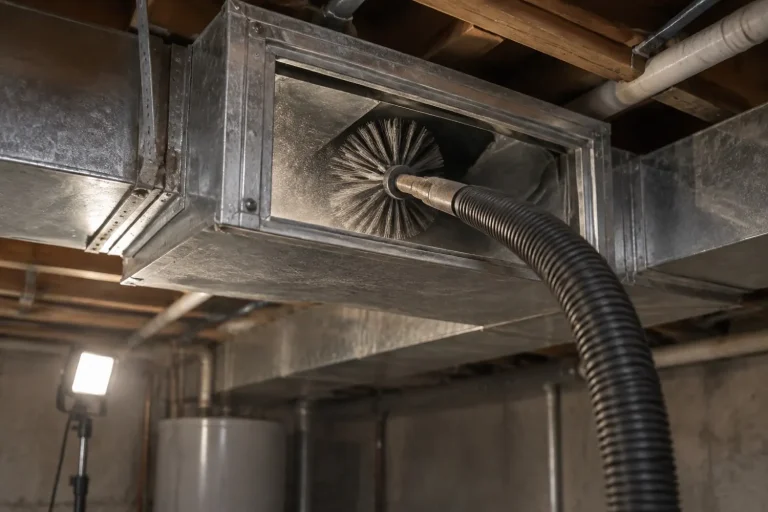 Air Duct Cleaning Cost 2026: $450 to $1,500 TypicalWhat the EPA says before you book, and when cleaning is indicated.
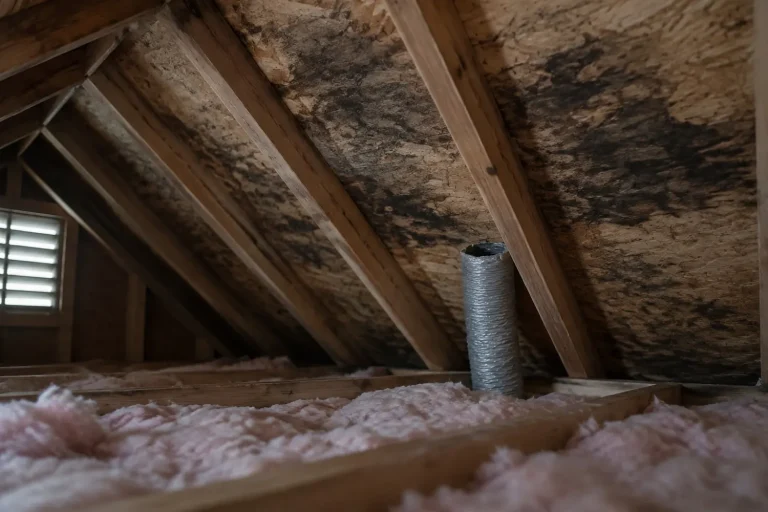 Attic Mold Removal Cost 2026: $1,500 to $10,000Sheathing, insulation and the ventilation fix that stops a repeat.
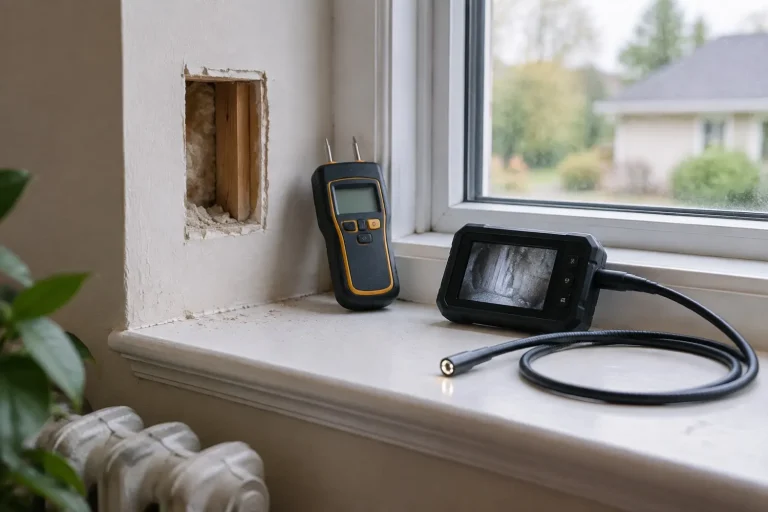 Mold Inspection Cost 2026: $300 to $1,000 TypicalWhat an inspection fee buys, lab fees and the conflict of interest.
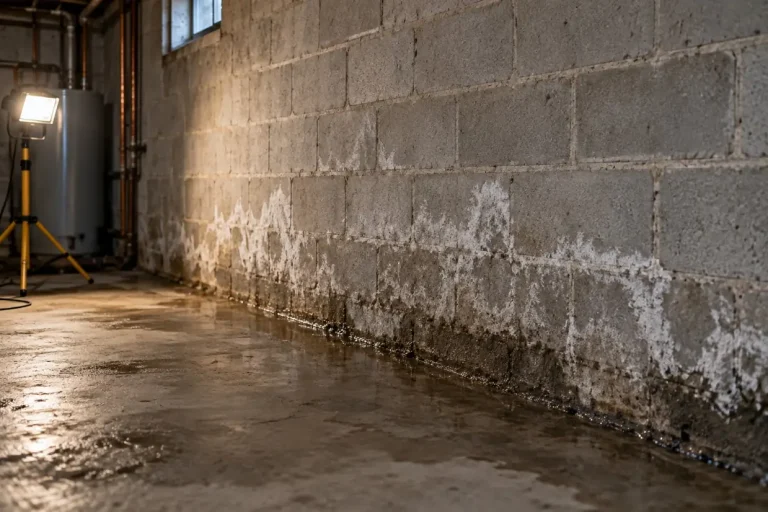 Basement Waterproofing Cost 2026: $2,500 to $20,000Method is chosen by diagnosis, from sealant to exterior membrane.
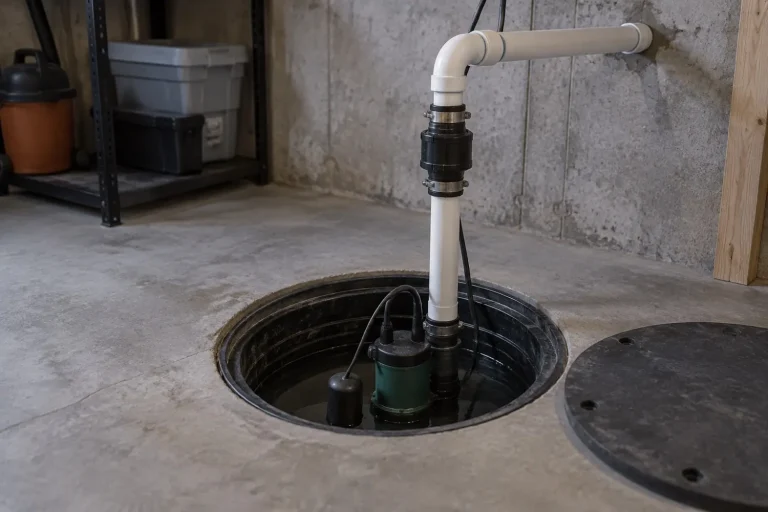 Sump Pump Installation Cost 2026: $600 to $5,000Pump, basin and backup tiers read against the loss they prevent.
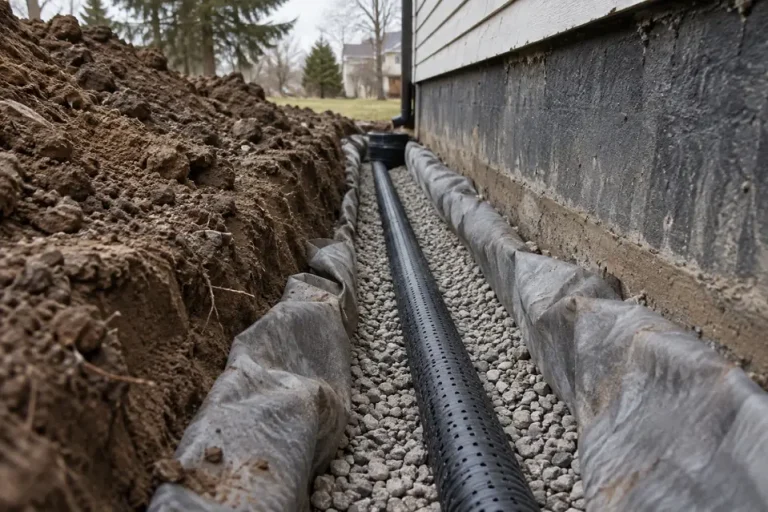 French Drain Cost 2026: $1,500 to $20,000 by TypeInterior against exterior, the decision that moves the price most.
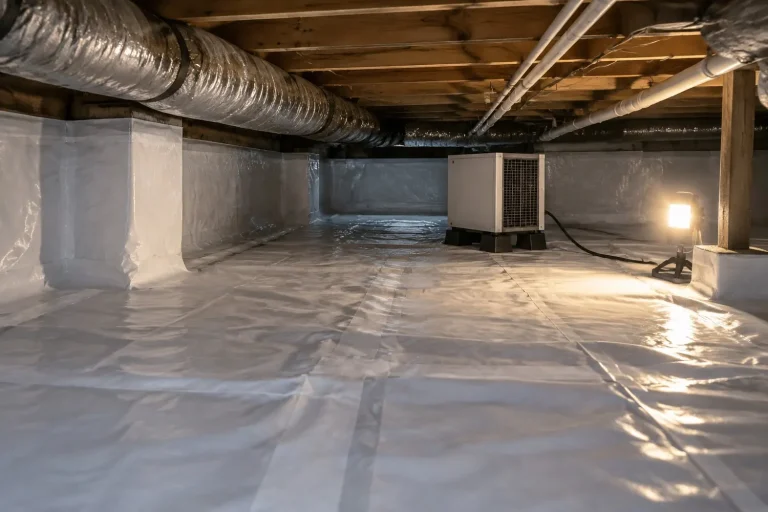 Crawl Space Encapsulation Cost 2026: $1,500 to $15,000Barrier, dehumidifier, drainage: the scope tiers that separate quotes.
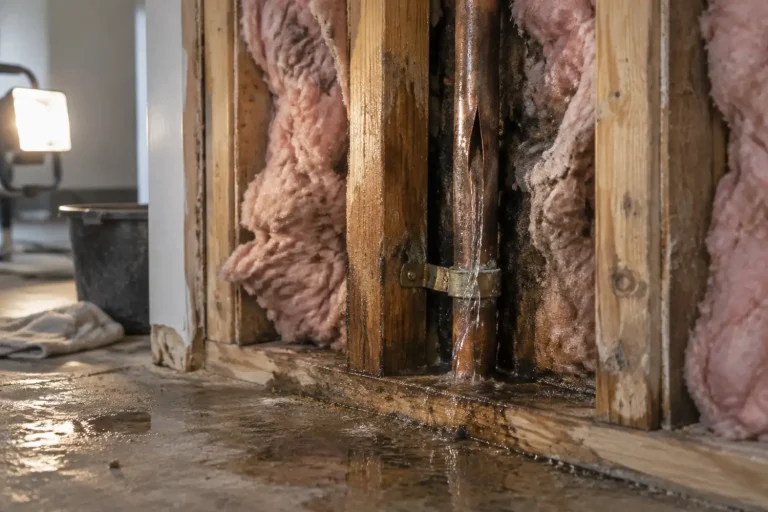 Burst Pipe Repair: Cost, Response and What Gets DamagedThe plumbing bill and the drying bill, and why response time costs.
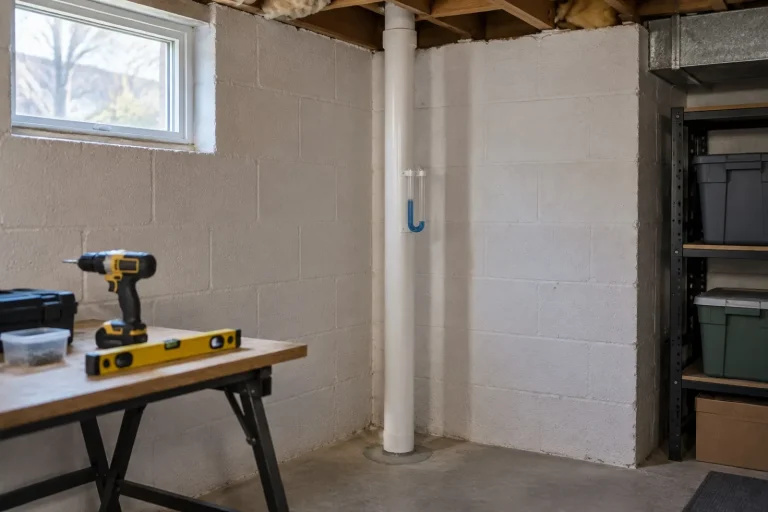 Radon Mitigation Cost: Published Prices, Fan Power and GrantsPublished prices by system type, fan running cost and state grants.
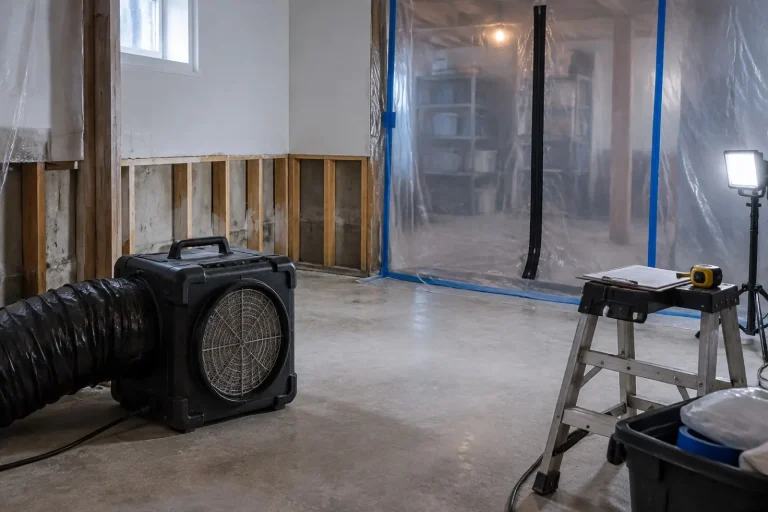 Mold Remediation Cost Calculator: Sourced Rates by AreaAn interactive estimate from sourced rates by area, location and material.
Related hubs
- Estimating. How a price becomes a line item: price lists, scope, overhead and profit, and supplements.
- Water. The drying standard and categories that drive most of these numbers.
- Mold. Process, inspection and regulation behind mould pricing.
- Insurance and claims. Which causes of loss get paid, described rather than advised.
Questions people actually ask
How much do restoration costs run for water damage?
According to our water damage restoration cost guide, mitigation runs about $3.00 to $4.25 per square foot on a clean-water loss and $7.00 to $12.00 on a contaminated one, with reconstruction a separate scope at roughly $20 to $37 per square foot. Those ranges are compiled from published contractor and aggregator price guides current in 2026 and are indicative, not quotes.
What is the difference between mitigation and restoration costs?
Mitigation stops and dries the damage: extraction, equipment, monitoring, selective demolition and disposal. Reconstruction puts the building back. Per our water damage cost guide, the two differ by roughly five times per square foot, and most confusing quotes turn out to compare one with the other.
Why is sewage cleanup so much more expensive than clean water?
Sewage is Category 3 under ANSI/IICRC S500, so porous materials it touched are removed rather than dried, with containment, PPE and disposal added. Our sewage guide puts it at two to three times a clean-water loss of the same size.
Why do small mold jobs carry a minimum charge?
Containment, negative air and decontamination cost about the same whatever the area. That is why, according to our mold remediation cost guide, contractors apply a $500 to $1,500 minimum, a range compiled from 2026 price guides.
Does homeowners insurance pay restoration costs?
It depends on cause and policy wording. Sudden and accidental discharge is generally treated differently from gradual leaks, and flood is generally excluded from standard homeowners policies and insured separately, for example through the FEMA National Flood Insurance Program. Only the policy, the insurer and your state insurance department can confirm what is covered.
Are restoration cost averages online reliable?
Treat them as indicative. Most do not publish a sample size or collection date, and many bundle mitigation with rebuild. Every range on this site says how it was compiled, and none is presented as a survey result.
How much of a disaster loss is contents rather than structure?
In SBA Disaster Loan Data for fiscal 2015 to 2022, contents make up 24.8% of verified home loss, $7.8bn of $31.3bn, as computed in our SBA disaster loan report.
Sources
- Remediation Insider cost guides linked in the master cost table. Ranges are quoted as each guide states them; each guide names its own basis, in most cases published contractor and aggregator price guides current in 2026.
- Institute of Inspection, Cleaning and Restoration Certification, ANSI/IICRC S500 (5th edition, 2021) and S520 (4th edition, 2024). Described, not reproduced.
- FEMA OpenFEMA, HousingAssistanceOwners v2 and NfipClaims v3. Retrieved 3 and 4 October 2026.
- US Small Business Administration, Disaster Loan Data, fiscal 2015 to 2022. Retrieved 6 October 2026.
- US Bureau of Labor Statistics, OEWS, SOC 47-4041, May 2025 estimates.
- US EPA, Should You Have the Air Ducts in Your Home Cleaned? and EPA asbestos NESHAP guidance.
- Florida Statutes Chapter 468, Part XVI, Mold-Related Services.
This product uses the Federal Emergency Management Agency’s OpenFEMA API, but is not endorsed by FEMA. The Federal Government or FEMA cannot vouch for the data or analyses derived from these data after the data have been retrieved from the Agency’s website(s).
How this page is maintained
This hub is a maintained page, last reviewed on 7 October 2026. Cost ranges are re-read from each live guide whenever a guide is revised. Every figure on it is either quoted from the linked guide with the source that guide names, or computed at build time from the public dataset behind the linked research report, so a change in either flows through here. Our methodology sets out the standing rules for sourcing and labelling, and if anything here is wrong, tell us through the corrections page.