The finding
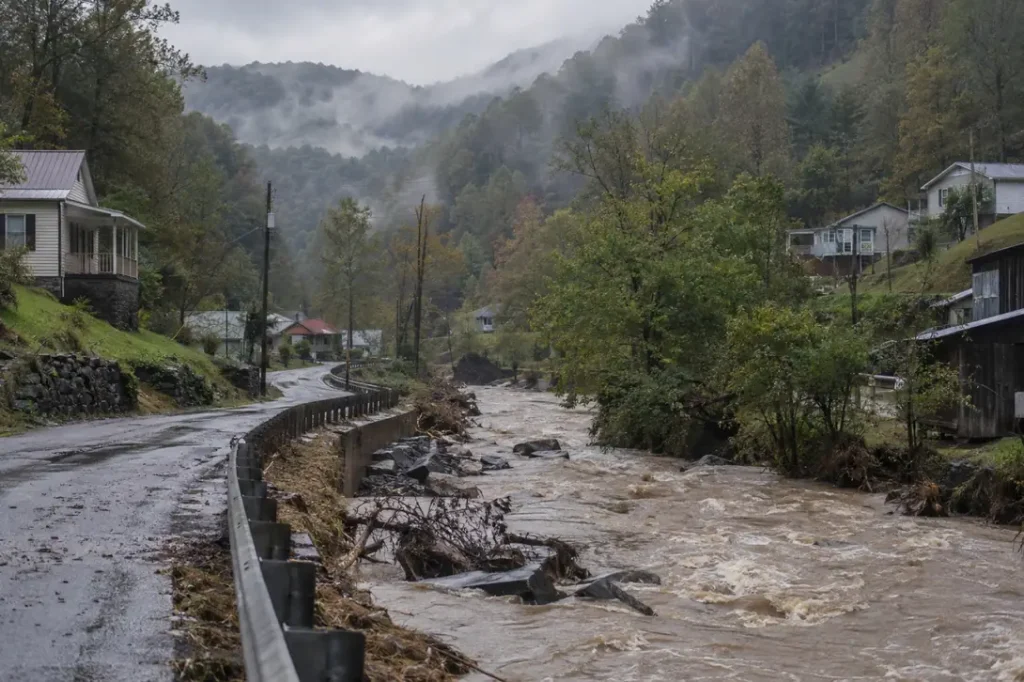
Since the start of 2015, the counties with the most disaster declarations in the United States sit almost entirely in Kentucky. Owsley County, Kentucky has been named in 19 major disaster declarations for storms, floods, fires and other restoration-type hazards through 1 September 2026, ahead of Clay County (18) and Lee County (17). 23 of the 25 counties with 12 or more declarations are in Kentucky, while the typical designated county has 3.
Headline figures
In this report
- The 25 most-declared counties
- Why the list is a Kentucky list
- How declarations spread across every county
- States: full coverage and blank maps
- The leading county for each hazard
- Year by year
- Flood insurance in the most-declared counties
- Puerto Rico, territories and tribal areas
- Method
- Reproduce this
- What this does not show
- Questions this report answers
- Sources
Key findings
- Owsley County, Kentucky leads with 19 major disaster declarations from 2015 to 1 September 2026, which is 79% of the 24 qualifying declarations Kentucky received (FEMA OpenFEMA).
- Kentucky holds 34 of the 71 counties with 10 or more declarations, a 48% share, and 23 of the 25 counties with 12 or more (FEMA OpenFEMA).
- Kentucky’s lead comes from breadth as well as frequency: its 24 declarations named a mean of 38.8 counties each, against a median of 11.7 across the 50 states, DC and Puerto Rico in this data (FEMA OpenFEMA).
- 2,793 counties and county-equivalents in the 50 states, DC and Puerto Rico were named at least once. The median designated county was named 3 times and the mean is 3.7 (FEMA OpenFEMA).
- 429 of 3,135 counties in the NFIP county list (13.7%) had no qualifying major declaration, led by Illinois with 56 (FEMA OpenFEMA).
- 15 states and DC had every county in the NFIP list named at least once; Arizona had the lowest coverage at 20% of its counties (FEMA OpenFEMA).
- Median flood insurance take-up rises with declaration count, from 0.34% of residential structures in never-declared counties to 0.87% in counties named 10 or more times (FEMA NFIP penetration file).
- 1,334 county designations were made in 2024, the peak full year, against 626 in 2018 (FEMA OpenFEMA).
The 25 most-declared counties
The table ranks every county by the number of distinct major disaster declarations that named it between 7 January 2015 and 1 September 2026, counting only the incident types that create restoration work. Ties share a rank, so the list runs to 25 counties at a cut-off of 12 declarations. The take-up column is the share of residential structures with an NFIP policy, from FEMA’s penetration file dated 3 August 2026.
| Rank | County | State | Declarations | Most common incident | Most recent | With IA approved | Flood take-up |
|---|---|---|---|---|---|---|---|
| 1 | Owsley County | Kentucky | 19 | Severe Storm (10) | 1 September 2026 | 8 | 0.30% |
| 2 | Clay County | Kentucky | 18 | Severe Storm (10) | 29 May 2026 | 7 | 0.68% |
| 3 | Lee County | Kentucky | 17 | Severe Storm (7) | 29 May 2026 | 8 | 0.57% |
| 4 | Johnson County | Kentucky | 15 | Severe Storm (7) | 24 April 2025 | 6 | 2.31% |
| 4 | Lawrence County | Kentucky | 15 | Severe Storm (6) | 24 April 2025 | 5 | 0.42% |
| 4 | Metcalfe County | Kentucky | 15 | Severe Storm (9) | 1 September 2026 | 5 | 0.23% |
| 4 | Whitley County | Kentucky | 15 | Severe Storm (7) | 29 May 2026 | 7 | 0.28% |
| 8 | Breathitt County | Kentucky | 14 | Severe Storm (6) | 23 May 2025 | 7 | 1.51% |
| 8 | Estill County | Kentucky | 14 | Severe Storm (7) | 23 May 2025 | 7 | 0.74% |
| 8 | Floyd County | Kentucky | 14 | Severe Storm (6) | 24 April 2025 | 6 | 3.35% |
| 8 | Jackson County | Kentucky | 14 | Severe Storm (8) | 1 September 2026 | 6 | 0.23% |
| 8 | Magoffin County | Kentucky | 14 | Flood (6) | 24 April 2025 | 6 | 1.55% |
| 8 | Perry County | Kentucky | 14 | Severe Storm (6) | 29 May 2026 | 6 | 1.95% |
| 8 | Powell County | Kentucky | 14 | Severe Storm (6) | 23 May 2025 | 5 | 1.98% |
| 8 | Rockcastle County | Kentucky | 14 | Severe Storm (8) | 1 September 2026 | 6 | 0.24% |
| 16 | Wolfe County | Kentucky | 13 | Severe Storm (5) | 24 April 2025 | 6 | 0.00% |
| 17 | Edwards County | Kansas | 12 | Severe Storm (9) | 1 September 2026 | 0 | 2.25% |
| 17 | Hodgeman County | Kansas | 12 | Severe Storm (9) | 1 September 2026 | 0 | 0.00% |
| 17 | Butler County | Kentucky | 12 | Severe Storm (9) | 1 September 2026 | 4 | 0.29% |
| 17 | Carter County | Kentucky | 12 | Severe Storm (5) | 24 April 2025 | 5 | 1.26% |
| 17 | Harlan County | Kentucky | 12 | Flood (5) | 24 February 2025 | 4 | 2.44% |
| 17 | Knott County | Kentucky | 12 | Severe Storm (6) | 23 May 2025 | 5 | 1.14% |
| 17 | Leslie County | Kentucky | 12 | Severe Storm (6) | 24 April 2025 | 6 | 0.77% |
| 17 | Menifee County | Kentucky | 12 | Severe Storm (6) | 29 May 2026 | 5 | 0.81% |
| 17 | Morgan County | Kentucky | 12 | Severe Storm (5) | 24 April 2025 | 5 | 0.39% |
2 of the 25 counties sit outside Kentucky: Edwards County, Kansas (12); Hodgeman County, Kansas (12). 2 of them had no declaration with approved Individual Assistance anywhere in the declared area, which points to declarations driven by damage to public infrastructure rather than to homes. That is a pattern in the data, not a cause it can prove.
For Owsley County, 8 of its 19 declarations (42%) included approved Individual Assistance somewhere in the declared area. Nationally, 217 of the 593 qualifying declarations (37%) did. The rest approved no household assistance, and their federal support ran through other programmes such as Public Assistance, which pays for roads, bridges and public buildings rather than homes. A county count therefore says how often a place was in a declared area, not how many households there needed restoration.
Why the list is a Kentucky list
Three things stack up in Kentucky. First, frequency: Kentucky received 24 qualifying major declarations, tied for the most of any state in the window, alongside Mississippi and Tennessee. Second, breadth: a Kentucky declaration named 38.8 counties on average, roughly 3.3 times the median state. Third, geography: Kentucky has 120 counties in the NFIP county list, many of them small, so one storm system crosses county lines more often than the same storm would in a state of large counties.
The result is that 119 of Kentucky’s 120 listed counties were named at least once, and Kentucky counties absorbed 932 county designations in total, of which 57% were labelled severe storm and 25% were labelled flood. None of this measures the dollar size of the damage. For how the timing of those declarations varies year to year, see the restoration demand volatility index, and for how long after an incident they arrive, the disaster declaration lag report.
How declarations spread across every county
The distribution is wide and skewed to the right. Across the full county list, zeros included, the median county was named 3 times. 429 counties were never named, and 71 were named 10 or more times. Over a window of 11.6 years, a median county was named about once every 4 years. The 71 counties named 10 or more times sit in just 14 states, so the long tail that matters most for restoration demand is regional rather than national.
States: full coverage and blank maps
| State | Counties named | Counties listed | Share named | County designations | Declarations | Counties per declaration |
|---|---|---|---|---|---|---|
| Texas | 254 | 254 | 100% | 860 | 19 | 45.3 |
| Georgia | 159 | 159 | 100% | 528 | 13 | 40.6 |
| Kentucky | 119 | 120 | 99% | 932 | 24 | 38.8 |
| Missouri | 113 | 115 | 98% | 518 | 20 | 25.9 |
| Virginia | 109 | 133 | 82% | 240 | 10 | 24.0 |
| Kansas | 104 | 105 | 99% | 478 | 22 | 21.7 |
| North Carolina | 100 | 100 | 100% | 256 | 11 | 23.3 |
| Iowa | 98 | 99 | 99% | 300 | 15 | 20.0 |
| Tennessee | 95 | 95 | 100% | 472 | 24 | 19.7 |
| Nebraska | 91 | 93 | 98% | 350 | 18 | 19.4 |
| Mississippi | 82 | 82 | 100% | 480 | 24 | 20.0 |
| Oklahoma | 77 | 77 | 100% | 446 | 19 | 23.5 |
| Arizona | 3 | 15 | 20% | 3 | 1 | 3.0 |
| Utah | 10 | 29 | 34% | 11 | 3 | 3.7 |
| New Mexico | 12 | 33 | 36% | 15 | 4 | 3.8 |
| Wyoming | 10 | 23 | 43% | 11 | 5 | 2.2 |
| Illinois | 46 | 102 | 45% | 59 | 5 | 11.8 |
Texas has the most counties named, 254, followed by Georgia with 159. Every listed county was named at least once in 15 states and DC: California, Delaware, Florida, Georgia, Louisiana, Mississippi, New Hampshire, New Jersey, North Carolina, Oklahoma, Rhode Island, South Carolina, Tennessee, Texas, Vermont. At the other end, Arizona had 3 of 15 counties named and Utah 10 of 29. Illinois has the most never-declared counties, 56. For the dollar side of the same declarations by state, see FEMA spending by state.
The leading county for each hazard
| Incident type | Counties named | Most for one county | Leading county |
|---|---|---|---|
| Severe Storm | 1,693 | 10 | Owsley County, Kentucky and Clay County, Kentucky |
| Flood | 1,449 | 6 | 9 counties tied |
| Hurricane | 829 | 8 | 10 counties tied |
| Severe Ice Storm | 612 | 3 | 17 counties tied |
| Winter Storm | 344 | 2 | 11 counties tied |
| Tropical Storm | 320 | 1 | 320 counties tied |
| Snowstorm | 253 | 2 | 6 counties tied |
| Tornado | 177 | 3 | Davidson County, Tennessee and Wilson County, Tennessee |
| Fire | 115 | 5 | Lake County, California |
| Mud/Landslide | 30 | 1 | 30 counties tied |
| Coastal Storm | 6 | 2 | York County, Maine |
| Dam/Levee Break | 5 | 1 | 5 counties tied |
Severe storms and floods are the broad base: 1,449 counties were named for a flood declaration and the most any county collected was 6. Hurricanes reached 829 counties, with a ceiling of 8. Fire is narrower: 115 counties, led by Lake County, California at 5. Because FEMA assigns one incident type per declaration, a storm that also flooded is filed under one label only.
The most-declared counties are not hit by an unusual hazard. In the 128 counties with 9 or more declarations, severe storm accounts for 42.8% of designations against 38.0% across all designated counties, and flood for 21.2% against 22.3%. They see the common mix, more often.
Year by year
| Year | Declarations | County designations | Distinct counties |
|---|---|---|---|
| 2015 | 39 | 844 | 699 |
| 2016 | 46 | 871 | 801 |
| 2017 | 53 | 1,032 | 893 |
| 2018 | 51 | 626 | 594 |
| 2019 | 51 | 1,169 | 1,032 |
| 2020 | 44 | 650 | 515 |
| 2021 | 54 | 1,093 | 880 |
| 2022 | 40 | 690 | 574 |
| 2023 | 58 | 819 | 701 |
| 2024 | 85 | 1,334 | 1,050 |
| 2025 | 39 | 665 | 499 |
| 2026 (to 1 September 2026) | 33 | 557 | 519 |
2024 was the heaviest full year, with 85 declarations naming 1,050 distinct counties. 2018 was the lightest, at 626 designations. The heaviest year carried 2.1 times the designations of the lightest, so a single year’s count is a weak guide to the next. Seasonal timing within the year is covered in the restoration seasonality calendar.
Flood insurance in the most-declared counties
The join between declared counties and the NFIP penetration file matched 2,706 of 2,715 declared counties in the 50 states and DC (99.7%). The 9 that did not match are Connecticut’s 8 former counties and Bedford (independent city), which has no row of its own in the penetration file.
Take-up does rise with declaration count. Never-declared counties have a median of 0.34% of residential structures covered by an NFIP policy, and counties named 10 or more times have 0.87%. Even in the most-declared group the median is below one policy per hundred homes. The federal purchase requirement applies to mortgaged buildings in mapped high-risk zones, and severe storms and inland flooding are not confined to those zones; the file cannot say which explains the low figures. The state pattern is mapped in the flood insurance take-up map, which counts storm and flood declarations only and so leaves out fire and winter declarations; its declaration bands, and the medians in them, differ from the ones here for that reason. This is a description of the data, not advice on whether to buy cover; FloodSmart.gov and state insurance departments are the places to ask.
Puerto Rico, territories and tribal areas
Puerto Rico municipios are counted as county-equivalents, as the Census Bureau treats them. 78 municipios were named at least once, led by Adjuntas Municipio at 5. They appear in the rankings but not in the insurance join, because the NFIP penetration file carries no Puerto Rico rows. Guam, the US Virgin Islands, American Samoa and the Northern Mariana Islands are left out of the county ranking: 40 designations there were set aside, along with 1 statewide row. 229 designations of tribal reservations, Alaska Native villages and Alaska education areas were also set aside, because they overlap counties rather than replace them.
Method
How we counted. We used 26,032 rows from FEMA OpenFEMA Disaster Declarations Summaries v2 for declarations dated 2015 onward, retrieved 23 September 2026. We kept the 14,901 major disaster rows (declarationType DR), dropping emergency and fire management declarations, and of those the 10,632 with one of thirteen restoration-type incident labels (fire, flood, severe storm, hurricane, tropical storm, typhoon, coastal storm, tornado, severe ice storm, snowstorm, winter storm, mud or landslide, dam or levee break). Rows were de-duplicated on disasterNumber, state and placeCode, removing 12. We set aside 1 statewide row, 40 island-area rows and 229 tribal and other non-county rows, leaving 10,350 county designations across 2,793 counties. A placeCode beginning 99 carries the county FIPS code in its last three digits; Virginia, Maryland, Missouri and Nevada independent cities were matched by name. One code was crosswalked: FEMA files Oglala Lakota County, South Dakota under its pre-2015 code 113, mapped to 102. The county universe is the 3,144 FIPS-coded rows of FEMA’s NFIP Residential Penetration Rates file (as of 3 August 2026, 3,159 rows including unknown-county rows), less Connecticut’s 9 planning regions. Take-up is resContractsInForce divided by totalResStructures. Individual Assistance status comes from FEMA Web Disaster Summaries (totalNumberIaApproved above zero) and is declaration-wide. Ranks share ties, and every group cut-off includes all counties tied at the boundary.
Reproduce this
Reproduce this
- Endpoint
https://www.fema.gov/api/open/v2/DisasterDeclarationsSummaries- Query
$filter=declarationDate ge '2015-01-01'&$select=disasterNumber,state,declarationDate,incidentType,declarationType,designatedArea,fyDeclared,incidentBeginDate,incidentEndDate,placeCode&$orderby=declarationDate (paged with $top and $skip)- Rows retrieved
- 26,032 declaration rows, of which 10,350 county designations after filtering
- Retrieved
- 23 September 2026 (declarations); 5 October 2026 (NFIP penetration rates and web disaster summaries)
Filter to declarationType DR and the thirteen incident types after retrieval, then de-duplicate on disasterNumber, state and placeCode. The county universe and take-up come from https://www.fema.gov/api/open/v1/NfipResidentialPenetrationRates, joined on five-digit FIPS. No API key is required.
What this does not show
What this does not show
- A designation is not a damage measure. A county named in a declaration may have had minor public infrastructure damage or widespread home losses; the count treats both the same.
- One declaration can cover many incidents. A single declaration often spans weeks of storms, floods and landslides under one incident label, so declarations undercount separate events.
- States decide which counties to request. County designations depend on state requests and FEMA thresholds, and the mean counties per declaration ranges from 1.0 to 45.3 across states.
- County size varies. States with many small counties produce more county designations from the same storm than states with a few large ones.
- Undeclared events are absent. Most water, fire and storm losses never reach a federal declaration and are not here.
- Individual Assistance is declaration-wide. The IA column shows whether any household assistance was approved in the declaration, not whether this county was designated for it; the per-county programme flags were not in the retrieved file.
- 2026 is partial. The last qualifying declaration in the file is dated 1 September 2026.
Most quotable figures
- Owsley County, Kentucky was named in 19 major disaster declarations from 2015 to 1 September 2026, the most of any US county (FEMA OpenFEMA, analysis by Remediation Insider).
- 34 of the 71 US counties with 10 or more major disaster declarations since 2015 are in Kentucky (FEMA OpenFEMA).
- A Kentucky major disaster declaration named 38.8 counties on average since 2015, against a state median of 11.7 (FEMA OpenFEMA).
- 429 US counties had no major disaster declaration for storms, floods, fires or similar hazards from 2015 to 1 September 2026 (FEMA OpenFEMA).
- In counties named in 10 or more major declarations since 2015, median NFIP take-up is 0.87% of homes (FEMA NFIP penetration data).
- Only 37% of restoration-type major disaster declarations since 2015 approved any FEMA Individual Assistance for households (FEMA OpenFEMA).
Questions this report answers
Which county has the most disaster declarations?
Owsley County, Kentucky, with 19 major disaster declarations for restoration-type hazards from 2015 to 1 September 2026. Clay County follows with 18 and Lee County with 17.
Why does Kentucky have so many of the most-declared counties?
Kentucky received 24 qualifying major declarations, tied for the most of any state, and each named 38.8 counties on average. It also has 120 counties, so storms cross many county lines.
How many disaster declarations does a typical county get?
The median designated county was named 3 times from 2015 to 1 September 2026. Including counties never named, the median is 3.
Are there counties with no disaster declarations?
Yes. 429 of 3,135 counties in the 50 states and DC (Connecticut excluded) had no qualifying major declaration in the window, with Illinois holding the most.
Do the most-declared counties carry more flood insurance?
Somewhat. Median NFIP take-up is 0.87% of residential structures in counties named 10 or more times, against 0.34% in counties never named. FloodSmart.gov is the place for cover questions.
How to cite
Remediation Insider. The Counties With the Most Disaster Declarations, 2015 to 2026. https://remediationinsider.com/most-declared-counties/ (retrieved 5 October 2026).
Data and tables in this report are released under CC BY 4.0. Attribution: Remediation Insider.
Sources
- Federal Emergency Management Agency. FEMA OpenFEMA Disaster Declarations Summaries, v2. 26,032 rows for declarations dated 2015 onward, retrieved 23 September 2026.
- Federal Emergency Management Agency. FEMA OpenFEMA NFIP Residential Penetration Rates, v1. County rows as of 3 August 2026, retrieved 5 October 2026.
- Federal Emergency Management Agency. FEMA OpenFEMA FEMA Web Disaster Summaries, v1. Individual Assistance approvals by declaration, retrieved 5 October 2026.
- FEMA, How a Disaster Gets Declared, for the request and designation process.
- FEMA OpenFEMA Terms and Conditions.
- No survey, interview or physical inspection was conducted for this report. Every figure is computed at build time from the retrieved FEMA files.
This product uses the Federal Emergency Management Agency’s OpenFEMA API, but is not endorsed by FEMA. The Federal Government or FEMA cannot vouch for the data or analyses derived from these data after the data have been retrieved from the Agency’s website(s).