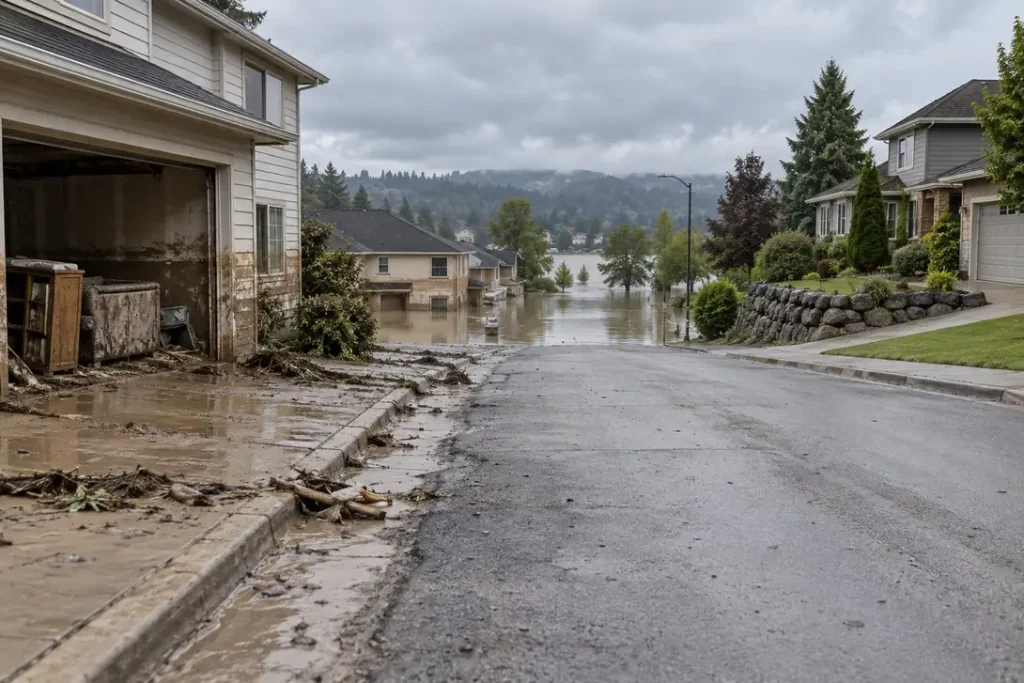
The finding
Flood zone exposure does not stop at the boundary drawn on the map. Across 624,103 National Flood Insurance Program claims since 2015 carrying a rated flood zone, 28.6% sit in B, C or X zones, the moderate to minimal risk designations outside the mapped high-risk area. Because cover is optional there and take-up is low, that claim share almost certainly understates the true out-of-zone share of flood losses. Median building damage there is $32,440 against $39,276 in A zones.
Headline figures
In this report
- What the zone families mean
- Every zone code in the file
- Share of claims by zone family
- Damage by zone family
- Out-of-zone share by state
- When the rated zone and the current map disagree
- The selection effect that shapes every figure here
- Data quality and the cleaning applied
- Method
- Reproduce this
- What this does not show
- Questions this report answers
- Sources
Key findings
- 28.6% of NFIP claims with a rated flood zone and a loss year of 2015 or later come from B, C or X zones, outside the mapped high-risk area. A zones hold 68.6% and V zones 2.8%.
- Median building damage is $39,276 in A zones, $19,830 in V zones and $32,440 in B, C and X zones, so the out-of-zone median sits 17% below the A zone one.
- V zones invert on the mean: $86,767 against $69,969 in A zones and $55,711 outside the high-risk area, despite the lowest median. Coastal NFIP claims carry the longest right tail in the file.
- The out-of-zone share varies by a factor of 7.0 between Colorado at 75.1% and Florida at 10.7% across 44 qualifying states in the FEMA NFIP file. On volume, Texas leads at 54.1% of 149,622 claims.
- On 536,251 FEMA NFIP claims carrying both a rated flood zone and a current mapped zone, the two differ on 7.5%. 5.1% differ at the family level, meaning the property has moved across the high-risk boundary, and 2.4% differ only in the code within one family.
- The largest family-level shift runs from B, C and X zones into A zones, 2.8% of paired FEMA NFIP claims. Median building damage on those remapped properties is $38,925 against $33,878 on properties that stayed outside the high-risk area.
- 62 distinct zone codes appear in the FEMA NFIP file, the highest median building damage among them being $48,918 in zone B.
What the zone families mean
Every NFIP policy carries a rated flood zone, the mapped flood hazard designation applied when the policy was rated. The groupings are not obvious from the letters alone, so following the published FEMA flood zone definitions:
- A-prefix zones are the 1% annual chance floodplain, commonly called the 100-year floodplain and formally the Special Flood Hazard Area. The family covers AE and the numbered A01 to A30 zones, which carry a base flood elevation; plain A, which does not; AH and AO for shallow ponding and sheet flow; and AR and A99 where a protection system is being restored or built.
- V-prefix zones are the same floodplain with coastal wave action added, which is why they are rated separately. VE carries a base flood elevation and plain V does not.
- B, C and X zones sit outside the mapped high-risk area. X is the current designation, covering the 0.2% annual chance floodplain and areas above it; B and C are the former designations and still appear on older ratings.
- D zones are areas with no flood hazard analysis, so risk is undetermined rather than low. They are kept separate here.
The distinction carrying the most weight is mandatory purchase. Per the FEMA, mandatory purchase requirement, flood insurance is required for a federally backed mortgage in an A or V zone and not required in B, C or X zones. That single difference shapes every figure here. Our report on flood insurance cost by state compares what policies cost inside and outside the high-risk zone.
Every zone code in the file
| Zone code | Claims | Family | Median building damage | What it means |
|---|---|---|---|---|
| AE | 370,947 | A zones | $41,842 | High risk. 1% annual chance floodplain, base flood elevation determined. |
| X | 158,856 | B, C and X zones | $30,961 | Moderate to minimal risk. Outside the 1% annual chance floodplain. |
| A | 25,935 | A zones | $28,912 | High risk. 1% annual chance floodplain, no base flood elevation. |
| VE | 16,798 | V zones | $20,361 | High risk, coastal. Wave action, base flood elevation determined. |
| C | 10,570 | B, C and X zones | $36,438 | Minimal risk. Former designation above the 0.2% annual chance floodplain. |
| B | 9,000 | B, C and X zones | $48,918 | Moderate risk. Former designation between the 1% and 0.2% annual chance floodplains. |
| AH | 7,720 | A zones | $34,476 | High risk. Shallow ponding, normally one to three feet. |
| AO | 3,533 | A zones | $22,355 | High risk. Shallow sheet flow, normally one to three feet. |
| AHB | 2,213 | A zones | $34,021 | High risk. Shallow ponding zone carrying a base flood depth. |
| A07 | 1,944 | A zones | $14,064 | High risk. Numbered floodplain from an older detailed study, carrying a base flood elevation. |
| A10 | 1,561 | A zones | $11,853 | High risk. Numbered floodplain from an older detailed study, carrying a base flood elevation. |
| A08 | 1,525 | A zones | $23,504 | High risk. Numbered floodplain from an older detailed study, carrying a base flood elevation. |
| A13 | 1,371 | A zones | $12,950 | High risk. Numbered floodplain from an older detailed study, carrying a base flood elevation. |
| A04 | 1,319 | A zones | $37,906 | High risk. Numbered floodplain from an older detailed study, carrying a base flood elevation. |
| A99 | 1,176 | A zones | $35,694 | High risk. Federal protection system under construction. |
| A06 | 1,150 | A zones | $38,239 | High risk. Numbered floodplain from an older detailed study, carrying a base flood elevation. |
| A02 | 1,017 | A zones | $28,925 | High risk. Numbered floodplain from an older detailed study, carrying a base flood elevation. |
| A05 | 1,011 | A zones | $19,580 | High risk. Numbered floodplain from an older detailed study, carrying a base flood elevation. |
| A11 | 834 | A zones | $18,340 | High risk. Numbered floodplain from an older detailed study, carrying a base flood elevation. |
| A03 | 723 | A zones | $21,652 | High risk. Numbered floodplain from an older detailed study, carrying a base flood elevation. |
| A12 | 638 | A zones | $20,121 | High risk. Numbered floodplain from an older detailed study, carrying a base flood elevation. |
| A01 | 608 | A zones | $33,767 | High risk. Numbered floodplain from an older detailed study, carrying a base flood elevation. |
| A09 | 593 | A zones | $10,790 | High risk. Numbered floodplain from an older detailed study, carrying a base flood elevation. |
| AOB | 548 | A zones | $26,554 | High risk. Shallow sheet flow zone carrying a base flood depth. |
| A15 | 539 | A zones | $32,514 | High risk. Numbered floodplain from an older detailed study, carrying a base flood elevation. |
| A14 | 356 | A zones | $16,632 | High risk. Numbered floodplain from an older detailed study, carrying a base flood elevation. |
| A18 | 227 | A zones | below reporting threshold | High risk. Numbered floodplain from an older detailed study, carrying a base flood elevation. |
| D | 216 | D zones | below reporting threshold | Risk undetermined. No flood hazard analysis conducted. |
| A16 | 164 | A zones | below reporting threshold | High risk. Numbered floodplain from an older detailed study, carrying a base flood elevation. |
| V13 | 160 | V zones | below reporting threshold | High risk, coastal. Numbered wave-action floodplain from an older detailed study. |
| A20 | 78 | A zones | below reporting threshold | High risk. Numbered floodplain from an older detailed study, carrying a base flood elevation. |
| V21 | 76 | V zones | below reporting threshold | High risk, coastal. Numbered wave-action floodplain from an older detailed study. |
| A17 | 69 | A zones | below reporting threshold | High risk. Numbered floodplain from an older detailed study, carrying a base flood elevation. |
| V16 | 67 | V zones | below reporting threshold | High risk, coastal. Numbered wave-action floodplain from an older detailed study. |
| V15 | 60 | V zones | below reporting threshold | High risk, coastal. Numbered wave-action floodplain from an older detailed study. |
| V12 | 57 | V zones | below reporting threshold | High risk, coastal. Numbered wave-action floodplain from an older detailed study. |
| V09 | 54 | V zones | below reporting threshold | High risk, coastal. Numbered wave-action floodplain from an older detailed study. |
| V20 | 40 | V zones | below reporting threshold | High risk, coastal. Numbered wave-action floodplain from an older detailed study. |
| A21 | 35 | A zones | below reporting threshold | High risk. Numbered floodplain from an older detailed study, carrying a base flood elevation. |
| V22 | 33 | V zones | below reporting threshold | High risk, coastal. Numbered wave-action floodplain from an older detailed study. |
| V10 | 32 | V zones | below reporting threshold | High risk, coastal. Numbered wave-action floodplain from an older detailed study. |
| V02 | 32 | V zones | below reporting threshold | High risk, coastal. Numbered wave-action floodplain from an older detailed study. |
| V17 | 28 | V zones | below reporting threshold | High risk, coastal. Numbered wave-action floodplain from an older detailed study. |
| V19 | 27 | V zones | below reporting threshold | High risk, coastal. Numbered wave-action floodplain from an older detailed study. |
| V14 | 22 | V zones | below reporting threshold | High risk, coastal. Numbered wave-action floodplain from an older detailed study. |
| V | 22 | V zones | below reporting threshold | High risk, coastal. Wave action, no base flood elevation. |
| A19 | 19 | A zones | below reporting threshold | High risk. Numbered floodplain from an older detailed study, carrying a base flood elevation. |
| V18 | 14 | V zones | below reporting threshold | High risk, coastal. Numbered wave-action floodplain from an older detailed study. |
| V08 | 12 | V zones | below reporting threshold | High risk, coastal. Numbered wave-action floodplain from an older detailed study. |
| V05 | 12 | V zones | below reporting threshold | High risk, coastal. Numbered wave-action floodplain from an older detailed study. |
| A23 | 12 | A zones | below reporting threshold | High risk. Numbered floodplain from an older detailed study, carrying a base flood elevation. |
| V11 | 10 | V zones | below reporting threshold | High risk, coastal. Numbered wave-action floodplain from an older detailed study. |
| V04 | 10 | V zones | below reporting threshold | High risk, coastal. Numbered wave-action floodplain from an older detailed study. |
| V07 | 9 | V zones | below reporting threshold | High risk, coastal. Numbered wave-action floodplain from an older detailed study. |
| A22 | 5 | A zones | below reporting threshold | High risk. Numbered floodplain from an older detailed study, carrying a base flood elevation. |
| V03 | 4 | V zones | below reporting threshold | High risk, coastal. Numbered wave-action floodplain from an older detailed study. |
| A30 | 4 | A zones | below reporting threshold | High risk. Numbered floodplain from an older detailed study, carrying a base flood elevation. |
| V01 | 2 | V zones | below reporting threshold | High risk, coastal. Numbered wave-action floodplain from an older detailed study. |
| AR | 2 | A zones | below reporting threshold | High risk. Floodplain reclassified while a protection system is restored. |
| A25 | 2 | A zones | below reporting threshold | High risk. Numbered floodplain from an older detailed study, carrying a base flood elevation. |
| A24 | 1 | A zones | below reporting threshold | High risk. Numbered floodplain from an older detailed study, carrying a base flood elevation. |
| A27 | 1 | A zones | below reporting threshold | High risk. Numbered floodplain from an older detailed study, carrying a base flood elevation. |
The concentration is heavy: AE and X together carry 84.9% of all classified claims. The long tail of numbered zones is a legacy of older detailed studies rather than a separate kind of risk, so the family is the unit of analysis and the code the unit of lookup.
Share of claims by zone family
A zones carry 68.6% of claims, B, C and X zones 28.6%, and V zones 2.8%. The out-of-zone figure covers properties not required to carry flood insurance, in areas the maps place outside the 1% annual chance floodplain, that flooded anyway and filed a claim.
| Loss year | Classified claims | Out-of-zone share |
|---|---|---|
| 2015 | 34,455 | 37.8% |
| 2016 | 85,159 | 25.9% |
| 2017 | 144,384 | 42.3% |
| 2018 | 41,913 | 29.5% |
| 2019 | 34,919 | 46.0% |
| 2020 | 33,133 | 29.3% |
| 2021 | 46,685 | 35.0% |
| 2022 | 60,257 | 11.7% |
| 2023 | 21,671 | 19.5% |
| 2024 | 102,040 | 10.1% |
| 2025 | 13,133 | 32.9% |
| 2026 | 6,138 | 30.7% |
The year-by-year figures move from 10.1% to 46.0% in the FEMA NFIP file. That is event composition rather than changing exposure: a coastal storm surge year concentrates claims inside the mapped zones, an inland rainfall year spreads them outside. No trend is readable here.
Damage by zone family
| Zone family | Claims | Claims with damage assessed | Median building damage | Mean building damage | Median payout ratio | Median depth (ft) |
|---|---|---|---|---|---|---|
| A zones, the 1% annual chance floodplain | 427,880 | 346,354 | $39,276 | $69,969 | 95.1% | 1.0 |
| V zones, coastal floodplain with wave action | 17,581 | 13,444 | $19,830 | $86,767 | 88.2% | 1.0 |
| B, C and X zones, moderate to minimal risk | 178,426 | 129,218 | $32,440 | $55,711 | 97.7% | 1.0 |
| D zones, risk undetermined | 216 | 137 | $40,797 | $61,579 | not enough data | not enough data |
Median building damage outside the high-risk zones is $32,440 against $39,276 inside the A zones, a difference of 17%, and median recorded depth is 1.0 feet in A zones against 1.0 feet outside them.
The V zone row does not behave as expected. V zones carry the lowest median of the three families at $19,830 and the highest mean at $86,767, making the coastal distribution the most skewed in the file. Payout ratios run 95.1% in A zones, 88.2% in V zones and 97.7% outside the high-risk area, and the V figure sitting lowest is consistent with larger losses pressing against programme coverage limits, which our insured flood loss gap report covers. Our companion report on flood loss by building type covers how occupancy interacts with these zones.
Out-of-zone share by state
| State | Classified claims | Out-of-zone share | High-risk share | Coastal V zone share |
|---|---|---|---|---|
| Colorado | 882 | 75.1% | 24.9% | 0.0% |
| Texas | 149,622 | 54.1% | 45.9% | 0.8% |
| South Dakota | 682 | 49.0% | 51.0% | 0.0% |
| Arizona | 815 | 48.3% | 51.7% | 0.0% |
| New Mexico | 715 | 48.0% | 52.0% | 0.0% |
| Minnesota | 862 | 47.7% | 52.3% | 0.0% |
| Maryland | 3,137 | 46.6% | 53.4% | 0.9% |
| New York | 12,497 | 39.3% | 60.7% | 0.9% |
| Virginia | 6,452 | 38.9% | 61.1% | 0.3% |
| California | 7,573 | 37.2% | 62.8% | 2.2% |
| Wisconsin | 2,236 | 36.7% | 63.3% | 0.0% |
| Kansas | 1,136 | 35.7% | 64.3% | 0.0% |
| Ohio | 3,549 | 35.0% | 65.0% | 0.1% |
| Oklahoma | 2,131 | 34.2% | 65.8% | 0.0% |
| Connecticut | 2,106 | 32.6% | 67.4% | 2.2% |
| Tennessee | 4,092 | 32.3% | 67.7% | 0.0% |
| Oregon | 795 | 30.6% | 69.4% | 3.5% |
| Rhode Island | 566 | 30.6% | 69.4% | 15.7% |
| Mississippi | 5,773 | 30.1% | 69.9% | 4.5% |
| Georgia | 7,989 | 28.8% | 71.2% | 1.3% |
| Michigan | 3,590 | 28.6% | 71.4% | 0.3% |
| Iowa | 2,231 | 28.6% | 71.4% | 0.0% |
| Louisiana | 72,854 | 28.3% | 71.7% | 1.6% |
| Illinois | 5,687 | 28.0% | 72.0% | 0.1% |
| Pennsylvania | 8,860 | 27.8% | 72.2% | 0.1% |
| Arkansas | 2,700 | 27.3% | 72.7% | 0.0% |
| Alabama | 6,055 | 25.0% | 75.0% | 12.6% |
| Puerto Rico | 1,091 | 23.7% | 76.3% | 2.2% |
| Hawaii | 1,620 | 23.7% | 76.3% | 13.8% |
| Indiana | 2,913 | 23.5% | 76.5% | 0.0% |
| North Carolina | 32,852 | 23.0% | 77.0% | 6.0% |
| South Carolina | 21,043 | 22.9% | 77.1% | 5.3% |
| Washington | 3,280 | 22.1% | 77.9% | 2.2% |
| West Virginia | 3,199 | 21.6% | 78.4% | 0.0% |
| New Jersey | 14,770 | 21.5% | 78.5% | 0.4% |
| Maine | 1,317 | 21.5% | 78.5% | 16.1% |
| Delaware | 646 | 21.1% | 78.9% | 4.0% |
| Vermont | 1,103 | 19.8% | 80.2% | 0.0% |
| Massachusetts | 3,962 | 18.7% | 81.3% | 16.6% |
| Nebraska | 1,701 | 18.6% | 81.4% | 0.0% |
| Missouri | 7,628 | 18.0% | 82.0% | 0.0% |
| Kentucky | 6,696 | 15.3% | 84.7% | 0.0% |
| New Hampshire | 710 | 14.8% | 85.2% | 4.9% |
| Florida | 201,331 | 10.7% | 89.3% | 4.6% |
Colorado leads at 75.1% of 882 claims and Florida sits last at 10.7%. The states at the top are inland or have substantial inland populations, where flooding comes from rainfall and stream overflow the mapped floodplain does not fully capture. Those at the bottom are coastal, where the mapped zones follow the shoreline closely. On volume, Texas holds the largest absolute pool of out-of-zone claims in the file at 54.1% of 149,622.
When the rated zone and the current map disagree
The claims file carries two zone fields. The rated flood zone is the designation used to rate the policy; the current flood zone is the designation on the map as it now stands. Per FEMA, changes to flood maps a property’s designation changes through map revisions and amendments, so the two can disagree. Across 536,251 claims carrying both they differ on 7.5%, of which 5.1% have crossed the high-risk boundary and 2.4% changed code within the same family, usually a detailed study replacing an older one.
| Rated zone family | Current zone family | Claims | Share of paired claims | Median building damage |
|---|---|---|---|---|
| A zones | A zones | 351,433 | 65.5% | $37,004 |
| B, C and X zones | B, C and X zones | 144,313 | 26.9% | $33,878 |
| B, C and X zones | A zones | 14,804 | 2.8% | $38,925 |
| V zones | V zones | 12,852 | 2.4% | $16,482 |
| A zones | V zones | 5,657 | 1.1% | $27,783 |
| A zones | B, C and X zones | 4,513 | 0.8% | $38,836 |
| V zones | A zones | 1,759 | 0.3% | $34,536 |
| B, C and X zones | V zones | 607 | 0.1% | $23,670 |
The largest movement runs from outside the high-risk area into it: 14,804 claims, 2.8% of paired claims, were rated in a B, C or X zone and now sit in an A zone on the current map, at a median building damage of $38,925 against $33,878 on properties that remain outside it.
That difference of 15% is a statistical association and nothing more, but it is worth recording: properties the current maps place inside the high-risk area carry larger median losses than those still mapped outside it, even though both were rated out-of-zone at the time of the claim.
Two cautions apply. The current zone field reflects the map as of retrieval, not as of the loss, so a disagreement does not establish when the revision happened relative to the flood. And a rated zone can differ through grandfathered ratings rather than a map change. These counts measure disagreement between two fields, which is exactly what they are presented as.
The selection effect that shapes every figure here
Everyone in this dataset bought flood insurance, and that is the single most important caveat on the 28.6% out-of-zone figure. Inside A and V zones cover is required for a federally backed mortgage, so much exposed property is insured and capable of producing a claim. Outside those zones cover is voluntary and take-up is far lower, so most out-of-zone property that floods never produces an NFIP claim. The file counts claims, not floods.
So 28.6% should be read as a floor rather than an estimate. If out-of-zone take-up matched in-zone take-up, the share would almost certainly be higher, because the same floods would generate claims from property that currently has no policy. This report cannot quantify by how much: the dataset holds no uninsured losses and no policy-in-force denominators.
The same logic applies to the state ranking: a state’s out-of-zone share reflects where its floods happen and where its residents buy voluntary cover. Colorado at 75.1% is a statement about its claims, not its flood exposure.
Data quality and the cleaning applied
| Issue | Claims affected | How we handled it |
|---|---|---|
| No rated flood zone recorded | 2,783 | Excluded from every figure in this report. |
| Zone code not classifiable into a family | 0 | Counted in the reference table, excluded from the family analysis. |
| Building damage below $1,000 | 42,007 | Excluded from damage medians, means and payout ratios. A single dollar of damage against five-figure payments destroys the ratio. |
| Depth recorded as exactly 99 feet | 13,551 | Excluded from the depth column. This is a sentinel value, not a measurement. |
| Negative depth | 17,085 | Excluded from the depth column. The dataset uses negative values for water below the first floor level. |
| Depth above 20 feet | 30,953 | Excluded from the depth column. Recorded depths run to several hundred feet, which is not plausible here. |
| No depth recorded | 76,981 | Excluded from the depth column, retained everywhere else. |
After those exclusions 624,103 of the 626,886 retrieved claims carry a classifiable rated flood zone, which is the sample behind the family shares.
Method
How we counted. We retrieved 626,886 NFIP redacted claim records with a loss year of 2015 or later from the FEMA OpenFEMA API on 4 October 2026. Each ratedFloodZone value was normalised to upper case and grouped into a family by first character: A and V prefixes are Special Flood Hazard Areas, B, C and X the moderate and minimal risk zones, and D is reported separately as undetermined. Codes fitting none of those are counted in the reference table and excluded from the family analysis. Damage medians, means and payout ratios use claims with assessed building damage of at least $1,000, because a placeholder figure against a real payment distorts every ratio built on it. Medians are preferred to means because the distribution is right skewed. Figures need at least 200 claims per group, or 500 per state or year. The remapping comparison uses the 536,251 claims carrying both ratedFloodZone and floodZoneCurrent. No inflation adjustment is applied, so figures are nominal.
Reproduce this
Reproduce this
- Endpoint
https://www.fema.gov/api/open/v3/NfipClaims- Query
$filter=yearOfLoss ge 2015- Rows retrieved
- 626,886 claims
- Retrieved
- 4 October 2026
The API pages at 5,000 rows via $top and $skip. No API key is required. The fields used here are ratedFloodZone, floodZoneCurrent, buildingDamageAmount, amountPaidOnBuildingClaim, waterDepth, state and yearOfLoss. Re-running this query will return a larger set as newer claims are added.
What this does not show
What this does not show
- Everyone in this dataset bought flood insurance, and that selects the out-of-zone figure downwards. Cover is mandatory inside A and V zones for a federally backed mortgage and voluntary outside them, where take-up is low, so 28.6% almost certainly understates the out-of-zone share of actual flood losses.
- These are insured flood losses only. NFIP covers policyholders. Uninsured flood damage, and every non-flood water loss such as burst pipes, appliance failures and sewer backups outside a flood event, are absent from this dataset entirely.
- Damage amount is not restoration cost. The field records assessed damage on the claim, not what a contractor billed.
- No policy-in-force denominator. This counts claims by zone, not claims per insured property, so a family’s share reflects how many policies sit in it as much as how often it floods.
- The current zone field is as of retrieval, not of the loss. A disagreement does not establish when the map was revised relative to the flood, and a rated zone can differ through grandfathered ratings.
- No inflation adjustment. Figures spanning 2015 to 2026 are nominal dollars.
- 2025 and 2026 are incomplete. Claims are filed and settled after the loss, so the most recent loss years hold fewer claims than they eventually will.
Most quotable figures
- 28.6% of NFIP flood claims since 2015 come from B, C or X zones, outside the mapped high-risk area, and because cover is voluntary there that is a floor rather than an estimate (FEMA OpenFEMA, n = 624,103).
- Median building damage outside the mapped high-risk zones is $32,440 against $39,276 inside A zones (FEMA NFIP claims, 2015 to 2026).
- On 7.5% of NFIP claims the rated flood zone and the current mapped zone disagree, and 5.1% disagree across the high-risk boundary itself.
- Coastal V zones carry the lowest median building damage of any family at $19,830 and the highest mean at $86,767 (FEMA NFIP claims, 2015 to 2026).
Questions this report answers
How many flood claims come from outside the high-risk flood zones?
28.6% of the 624,103 NFIP claims since 2015 with a classifiable rated flood zone come from B, C or X zones. A zones hold 68.6% and coastal V zones 2.8%.
What is the difference between an A zone and an X zone?
An A zone is inside the 1% annual chance floodplain, the Special Flood Hazard Area, where flood insurance is required for a federally backed mortgage. An X zone sits outside it and cover is voluntary. B and C are the former designations for that area.
What does a V zone mean?
The 1% annual chance floodplain with coastal wave action added, which is why it is rated separately from an A zone. V zones carry 2.8% of NFIP claims since 2015, at a median building damage of $19,830 and the highest mean of any family at $86,767.
Is flood damage smaller outside the high-risk zones?
At the median, yes. Median building damage is $32,440 in B, C and X zones against $39,276 in A zones, a difference of 17%, and median recorded depth is also lower.
How often does a property’s rated flood zone differ from the current map?
On 7.5% of the 536,251 NFIP claims carrying both fields, of which 5.1% differ across the high-risk boundary itself.
Does this mean out-of-zone flood risk is lower than people think?
The opposite reading is safer. Cover is voluntary outside the high-risk zones and take-up is low, so most out-of-zone property that floods never produces an NFIP claim. 28.6% counts only insured out-of-zone losses and is a floor.
Can I reuse this data?
Yes. The tables and derived figures are released under CC BY 4.0 with attribution to Remediation Insider. The underlying claims data is public and available from FEMA.
How to cite
Remediation Insider. The Flood Zone Exposure Report: Claims Outside the Mapped Risk. https://remediationinsider.com/flood-zone-exposure-report/ (retrieved 4 October 2026).
Data and tables in this report are released under CC BY 4.0. Attribution: Remediation Insider.
Sources
- Federal Emergency Management Agency. FEMA OpenFEMA NFIP Redacted Claims, v3. Claims with loss year 2015 or later. 626,886 records retrieved 4 October 2026.
- FEMA flood zone definitions. Used for every zone code meaning in the reference table.
- FEMA, mandatory purchase requirement. Used for the mandatory purchase distinction between zone families.
- FEMA, changes to flood maps. Used for how a property’s mapped designation changes.
- Field definitions for
ratedFloodZoneandfloodZoneCurrentare taken from the FEMA OpenFEMA NfipClaims data dictionary. - FEMA OpenFEMA Terms and Conditions.
- No survey, interview or physical inspection was conducted for this report. Every figure is computed from the retrieved claims file.
This product uses the Federal Emergency Management Agency’s OpenFEMA API, but is not endorsed by FEMA. The Federal Government or FEMA cannot vouch for the data or analyses derived from these data after the data have been retrieved from the Agency’s website(s).