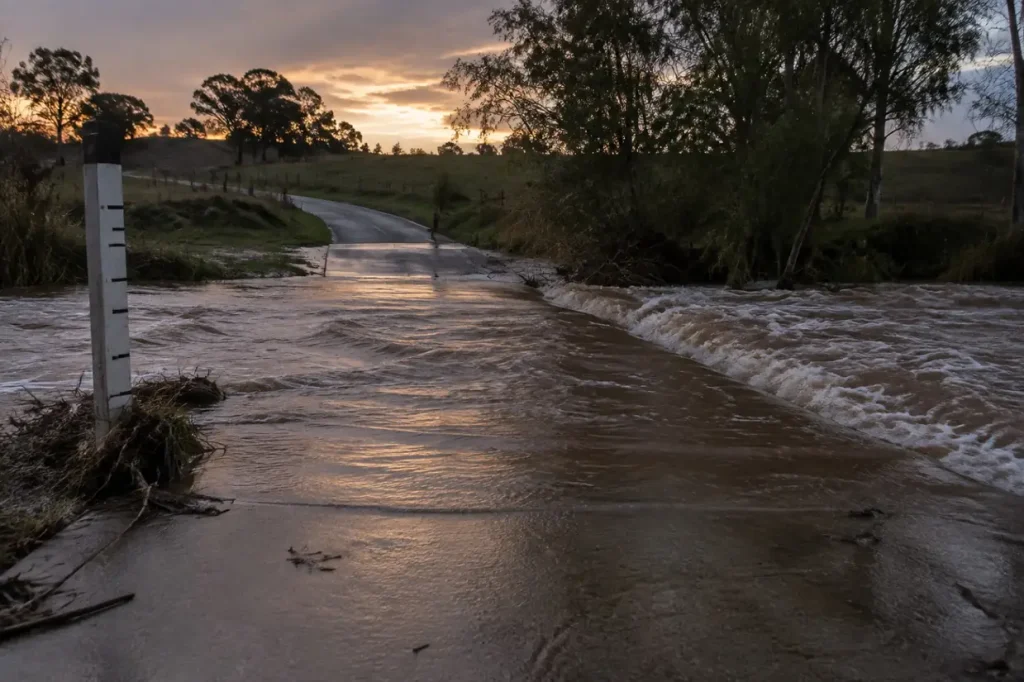
The finding
Ranked as flash flood deaths by state, Texas stands apart. NOAA Storm Events records for 2015 to 2025 attribute 338 of the 1,089 deaths logged in Flash Flood events to Texas, 31% of the national count and more than the next 5 states combined. North Carolina is second with 105. A single Texas county, Kerr, recorded 117 deaths in one episode in July 2025, more than any state other than Texas recorded across all 11 years.
Headline figures
In this report
- The state ranking
- Deaths per million residents
- The counties behind the totals
- A handful of episodes
- Damage tells a different story
- What sent the water
- When flash floods kill
- Year by year
- Flash Flood is not Flood
- Data treatment
- Method
- Reproduce this
- What this does not show
- Questions this report answers
- Sources
Key findings
- Texas recorded 338 Flash Flood deaths from 2015 to 2025, 31% of the 1,089 in NOAA’s Storm Events Database, across 4,728 event records.
- Kerr County, Texas: 117 deaths in July 2025. Over the full window, every other state and DC recorded fewer Flash Flood deaths than that one county did in one episode (NOAA).
- Adjusted for population, West Virginia leads with 18.6 deaths per million residents, ahead of Kentucky (14.2) and New Mexico (13.1). Texas ranks 4th on this measure (NOAA, Census Vintage 2025).
- 14 states and DC recorded no Flash Flood deaths at all, including Georgia with 1,154 events and Florida with 756 (NOAA).
- The $80.8 billion of reported property damage is extremely concentrated: the top 10 episodes hold 86% of it, and one episode alone (Texas, August 2017) holds 47% (NOAA).
- Only 33% of Flash Flood records carry a property damage estimate above zero; the median of those is $10,000 (NOAA).
- Deaths and damage do not line up. The Kentucky episode of July 2022, the 4th deadliest with 40 deaths, carries $35,000 of reported property damage, and the New Jersey episode of September 2021 recorded 13 deaths and $0 (NOAA).
- Per 1,000 event records, Flash Flood events carry 23.7 deaths against 10.8 for the separate Flood type, 2.2 times as many (NOAA).
The state ranking
The table ranks the 50 states and DC by deaths recorded in NOAA Flash Flood event records from 2015 to 2025. Direct and indirect deaths are shown separately, because NWS Storm Data classifies them differently: a direct death is attributable to the flood itself, an indirect death occurs in the vicinity of the event or after it, with the weather a passive agent (NWS Instruction 10-1605, Storm Data Preparation (26 July 2021), section 2.6). Of the national total, 1,049 deaths (96%) are direct, according to NOAA records. Source: NOAA NCEI Storm Events.
| State | Flash Flood events | Direct deaths | Indirect deaths | Total deaths | Events with a death | Deaths per million |
|---|---|---|---|---|---|---|
| Texas | 4,728 | 326 | 12 | 338 | 97 | 10.8 |
| North Carolina | 1,881 | 101 | 4 | 105 | 39 | 9.5 |
| Kentucky | 1,757 | 64 | 1 | 65 | 27 | 14.2 |
| Tennessee | 1,264 | 51 | 4 | 55 | 20 | 7.6 |
| Missouri | 2,399 | 45 | 2 | 47 | 32 | 7.5 |
| Arizona | 2,094 | 45 | 0 | 45 | 30 | 5.9 |
| West Virginia | 1,003 | 33 | 0 | 33 | 8 | 18.6 |
| New Jersey | 955 | 30 | 2 | 32 | 16 | 3.4 |
| Utah | 536 | 29 | 0 | 29 | 8 | 8.3 |
| New Mexico | 730 | 25 | 3 | 28 | 21 | 13.1 |
| Oklahoma | 1,496 | 26 | 1 | 27 | 24 | 6.6 |
| Pennsylvania | 2,288 | 21 | 2 | 23 | 13 | 1.8 |
| New York | 1,775 | 21 | 2 | 23 | 17 | 1.2 |
| California | 1,331 | 23 | 0 | 23 | 17 | 0.6 |
| Louisiana | 1,516 | 20 | 0 | 20 | 18 | 4.3 |
| South Carolina | 954 | 20 | 0 | 20 | 17 | 3.7 |
| Alabama | 1,047 | 17 | 0 | 17 | 14 | 3.3 |
| Indiana | 648 | 11 | 3 | 14 | 7 | 2.0 |
| Virginia | 1,942 | 13 | 0 | 13 | 10 | 1.5 |
| Arkansas | 1,517 | 12 | 0 | 12 | 10 | 3.9 |
| Illinois | 1,133 | 11 | 0 | 11 | 7 | 0.9 |
| Ohio | 1,089 | 9 | 0 | 9 | 6 | 0.8 |
| Maryland | 790 | 7 | 2 | 9 | 6 | 1.4 |
| Colorado | 563 | 9 | 0 | 9 | 5 | 1.5 |
| Wisconsin | 383 | 6 | 1 | 7 | 7 | 1.2 |
| Nevada | 315 | 6 | 1 | 7 | 6 | 2.1 |
| Mississippi | 1,551 | 6 | 0 | 6 | 4 | 2.0 |
| Kansas | 1,037 | 6 | 0 | 6 | 5 | 2.0 |
| Hawaii | 223 | 6 | 0 | 6 | 6 | 4.1 |
| Vermont | 170 | 5 | 0 | 5 | 5 | 7.7 |
| Connecticut | 328 | 3 | 0 | 3 | 2 | 0.8 |
| Alaska | 3 | 3 | 0 | 3 | 1 | 4.1 |
| Iowa | 751 | 2 | 0 | 2 | 2 | 0.6 |
| Nebraska | 490 | 2 | 0 | 2 | 2 | 1.0 |
| North Dakota | 82 | 2 | 0 | 2 | 1 | 2.5 |
| Michigan | 117 | 1 | 0 | 1 | 1 | 0.1 |
14 states and dc recorded Flash Flood events but no Flash Flood deaths over the 11 years, according to NOAA: Georgia (1,154 events), Florida (756 events), Minnesota (419 events), Massachusetts (300 events), South Dakota (272 events), New Hampshire (256 events), Maine (184 events), Wyoming (161 events), Montana (111 events), Delaware (102 events), Idaho (87 events), Washington (76 events), District of Columbia (56 events), Rhode Island (54 events), Oregon (18 events). Source: NOAA NCEI Storm Events.
The STATE column of the Storm Events files also carries island areas, which are kept out of the ranking above: Puerto Rico (907 events, 31 deaths), American Samoa (84 events, 1 death), Virgin Islands (20 events, 0 deaths), Guam (12 events, 0 deaths). Puerto Rico’s 31 deaths equal 9.7 per million residents, using the same Census 2025 base. Source: NOAA NCEI Storm Events.
Deaths per million residents
Raw counts favour large states. Dividing each state’s 2015 to 2025 deaths by its 2025 population changes the order. Only states with at least 10 deaths are ranked, so that a single fatal event in a small state does not top the list. West Virginia leads at 18.6 per million from 33 deaths; Texas, first by count, ranks 4th at 10.8. Sources: NOAA NCEI Storm Events; Census Vintage 2025.
Read the rate as a ranking aid, not an annual risk. It is cumulative over 11 years and uses 2025 residents only; people who died while travelling through a state are counted where the event occurred. Source: NOAA NCEI Storm Events.
The counties behind the totals
Flash Flood records are logged per county, so the state totals can be broken down. Of the 2,890 counties and county equivalents with a Flash Flood record from 2015 to 2025, 350 recorded at least one death (NOAA). The deadliest, Kerr County, Texas, logged 22 events and 117 deaths, all of them in July 2025. Source: NOAA NCEI Storm Events.
| County | State | Flash Flood events | Deaths | Deaths in deadliest episode | Deadliest episode |
|---|---|---|---|---|---|
| Kerr County | Texas | 22 | 117 | 117 | July 2025 |
| Harris County | Texas | 102 | 56 | 38 | August 2017 |
| Buncombe County | North Carolina | 14 | 24 | 24 | September 2024 |
| Washington County | Utah | 122 | 21 | 20 | September 2015 |
| Bexar County | Texas | 212 | 20 | 13 | June 2025 |
| Humphreys County | Tennessee | 17 | 20 | 20 | August 2021 |
| Greenbrier County | West Virginia | 21 | 16 | 16 | June 2016 |
| Knott County | Kentucky | 13 | 16 | 16 | July 2022 |
| Gila County | Arizona | 171 | 15 | 10 | July 2017 |
| Yancey County | North Carolina | 7 | 13 | 13 | September 2024 |
| Queens County | New York | 67 | 11 | 11 | September 2021 |
| Hays County | Texas | 49 | 11 | 10 | May 2015 |
The counties where flash flooding is logged most often are not the deadliest. The 12 counties with the most Flash Flood records, led by Maricopa County, Arizona (457 events), account for 78 deaths between them. Under NWS criteria a Flash Flood record can be triggered by a maintained road closed by high water or by runoff entering a building (NWS Instruction 10-1605, Storm Data Preparation (26 July 2021), section 14.1), so a high count marks where water repeatedly reached roads and structures, the exposure most relevant to restoration work. Source: NOAA NCEI Storm Events.
| County | State | Flash Flood events | Deaths |
|---|---|---|---|
| Maricopa County | Arizona | 457 | 8 |
| San Bernardino County | California | 409 | 7 |
| Mohave County | Arizona | 409 | 4 |
| Allegheny County | Pennsylvania | 317 | 0 |
| Yavapai County | Arizona | 237 | 3 |
| Bexar County | Texas | 212 | 20 |
| Pima County | Arizona | 205 | 5 |
| Richland County | South Carolina | 174 | 9 |
| Wake County | North Carolina | 172 | 1 |
| Gila County | Arizona | 171 | 15 |
| Orleans County | Louisiana | 170 | 1 |
| Coconino County | Arizona | 167 | 5 |
For the counties FEMA designates most often after disasters of every kind, see the counties with the most disaster declarations. The two lists measure different things: a Storm Events record needs no declaration, and a declaration needs no recorded death.
A handful of episodes
NOAA groups event records into episodes: one weather system, often spanning many counties. The 1,089 Flash Flood deaths fall in 374 of 12,552 episodes, and the 10 deadliest episodes account for 36% of all deaths (NOAA). Episodes are named here only by the NOAA episode ID, state and month in the file. Source: NOAA NCEI Storm Events.
| Episode ID | State | Month | County records | Deaths | Reported property damage |
|---|---|---|---|---|---|
| 204934 | Texas | July 2025 | 23 | 117 | $205.0 million |
| 196694 | North Carolina | September 2024 | 37 | 64 | $1.6 billion |
| 119753 | Texas | August 2017 | 72 | 55 | $38.3 billion |
| 172563 | Kentucky | July 2022 | 22 | 40 | $35,000 |
| 120357 | Puerto Rico | September 2017 | 41 | 20 | $18.3 billion |
| 162118 | Tennessee | August 2021 | 25 | 20 | $101.0 million |
| 100563 | Utah | September 2015 | 2 | 20 | $750,000 |
| 119746 | Texas | August 2017 | 6 | 18 | $5.3 billion |
| 163555 | New York | September 2021 | 75 | 18 | $470.9 million |
| 162538 | New Jersey | September 2021 | 17 | 16 | $220.0 million |
Damage tells a different story
Flash Flood records from 2015 to 2025 carry $80.8 billion in reported property damage, of which $61.8 billion is in the 50 states and DC (NOAA). That sum is nominal and made of estimates: NWS guidance requires a monetary amount for flood events “even if it is an estimate” (NWS Instruction 10-1605, Storm Data Preparation (26 July 2021), section 2.7). Source: NOAA NCEI Storm Events.
The total is dominated by a few systems. Episode 119753 (Texas, August 2017) holds 47% of the 2015 to 2025 total (NOAA), and the 10 largest episodes 86%. At the level of single county records, the 10 largest hold 57% (NOAA). A typical record is small: 30,832 of 45,915 records (67%) carry 0.00K (NOAA), and the median of the 15,083 positive estimates is $10,000. Source: NOAA NCEI Storm Events.
| State | Reported damage | Records with an estimate above $0 | Median positive estimate | Deaths |
|---|---|---|---|---|
| Texas | $47.6 billion | 24% | $10,000 | 338 |
| Louisiana | $3.9 billion | 22% | $25,000 | 20 |
| North Carolina | $2.3 billion | 43% | $10,000 | 105 |
| Illinois | $1.1 billion | 15% | $30,000 | 11 |
| California | $987.7 million | 48% | $5,000 | 23 |
| Michigan | $679.4 million | 54% | $100,000 | 1 |
| New York | $674.3 million | 48% | $15,000 | 23 |
| New Mexico | $565.3 million | 43% | $30,000 | 28 |
| Pennsylvania | $463.2 million | 40% | $5,000 | 23 |
| Missouri | $406.6 million | 12% | $50,000 | 47 |
Puerto Rico, outside the ranking, reports $19.0 billion of Flash Flood property damage (NOAA), more than every state and DC except Texas. For dollar-weighted context on the largest events, see the billion-dollar disaster record, and for flood losses restated for inflation, inflation-adjusted flood damage. Source: NOAA NCEI Storm Events.
Deaths and dollars measure different harm. Episode 163518 (New Jersey, September 2021) ranks 15th of 12,552 episodes by deaths, with 13 deaths across 52 county records (NOAA), yet every one of those records carries $0 in property damage. A recorded zero may mean no damage or damage that was not obtained; the file does not distinguish them. A ranking by damage gives this episode no weight at all. Source: NOAA NCEI Storm Events.
What sent the water
Each flood record carries a FLOOD_CAUSE field, the “reported or estimated cause of the flood” (NCEI Storm Data bulk CSV format documentation). Heavy rain on its own dominates the count. Tropical systems are a small share of records, 3.5%, but carry 12% of deaths and 77% of reported damage (NOAA). Source: NOAA NCEI Storm Events.
| Cause | Flash Flood events | Deaths | Deaths per 1,000 events | Reported property damage |
|---|---|---|---|---|
| Heavy rain | 43,412 | 926 | 21.3 | $18.0 billion |
| Heavy rain, tropical system | 1,610 | 136 | 84.5 | $62.2 billion |
| Heavy rain on a burn area | 606 | 23 | 38.0 | $170.7 million |
| Heavy rain with snowmelt | 155 | 0 | 0.0 | $26.1 million |
| Dam or levee break | 93 | 4 | 43.0 | $440.7 million |
| Ice jam | 38 | 0 | 0.0 | $2.8 million |
| Planned dam release | 1 | 0 | 0.0 | $0 |
Burn-area flash floods, where rain falls on ground stripped by wildfire, are logged as their own cause: 606 records and 23 deaths, 38.0 per 1,000 records against 21.3 for heavy rain alone (NOAA). The burn-area figure rests on few deaths and should be read as indicative. Source: NOAA NCEI Storm Events.
When flash floods kill
July, August and September hold 667 of the 1,089 Flash Flood deaths (61%, NOAA). July has the most deaths of any month (266) and July the most Flash Flood records (9,494, NOAA). The separate Flood type has the most records in May. Monthly restoration demand is set out in the restoration seasonality calendar. Source: NOAA NCEI Storm Events.
Year by year
Annual deaths swing from 37 in 2023 to 209 in 2025, an average of 99 a year. The swings follow single episodes: the deadliest episode of 2025 (Texas, July 2025) accounts for 56% of that year’s deaths (NOAA). A window of 11 years, dominated by single systems, is too short to read a trend. Source: NOAA NCEI Storm Events.
| Year | Events | Deaths | Direct deaths | Reported damage | Deadliest episode (deaths) |
|---|---|---|---|---|---|
| 2015 | 5,063 | 152 | 142 | $1.8 billion | Utah, September 2015 (20) |
| 2016 | 3,586 | 94 | 86 | $3.6 billion | West Virginia, June 2016 (16) |
| 2017 | 3,662 | 131 | 123 | $63.1 billion | Texas, August 2017 (55) |
| 2018 | 4,378 | 55 | 54 | $683.1 million | Virginia, October 2018 (5) |
| 2019 | 4,084 | 42 | 42 | $1.4 billion | Texas, September 2019 (3) |
| 2020 | 3,569 | 40 | 39 | $471.1 million | Indiana, March 2020 (6) |
| 2021 | 4,797 | 138 | 134 | $2.4 billion | Tennessee, August 2021 (20) |
| 2022 | 3,097 | 74 | 73 | $1.2 billion | Kentucky, July 2022 (40) |
| 2023 | 3,625 | 37 | 37 | $1.6 billion | Pennsylvania, July 2023 (7) |
| 2024 | 4,661 | 117 | 113 | $3.1 billion | North Carolina, September 2024 (64) |
| 2025 | 5,393 | 209 | 206 | $1.3 billion | Texas, July 2025 (117) |
Partial year, not ranked: the 2026 details file (StormEvents_details-ftp_v1.0_d2026_c20260918.csv.gz) held 1,709 Flash Flood records and 8 deaths at retrieval (NOAA), with the latest Flash Flood or Flood record beginning in June 2026. Later months were not yet in the file, so the 2026 count is incomplete and is not comparable with the full years above. Source: NOAA NCEI Storm Events.
Flash Flood is not Flood
Storm Data separates the two. NWS Instruction 10-1605 defines a Flash Flood as “A life-threatening, rapid rise of water into a normally dry area beginning within minutes to multiple hours of the causative event (e.g., intense rainfall, dam failure, ice jam).” and a Flood as “Any high flow, overflow, or inundation by water which causes damage.” The preparer judges when a flash flood has become a flood (NWS Instruction 10-1605, Storm Data Preparation (26 July 2021), Appendix A, sections 14 and 15). This report counts Flash Flood records only; a ranking that mixed both would blend fast, life-threatening water with slower river and areal flooding.
Per record, Flash Flood events carry 2.2 times the death rate of Flood events (23.7 against 10.8 per 1,000, NOAA). The Flood type is led by California by record count, the Flash Flood type by Texas. NFIP flood insurance claims by state are a third, different measure, covered in flood claims by state. Source: NOAA NCEI Storm Events.
This report gives no safety advice of its own. The National Weather Service publishes its flood safety guidance on the Turn Around Don’t Drown page.
Data treatment
| Rule | Records affected | Treatment |
|---|---|---|
| Blank DAMAGE_PROPERTY (not estimated) | 0 | Would be excluded from damage sums and medians. None occur: NWS requires an amount for flood events. |
| DAMAGE_PROPERTY recorded as 0.00K | 30,832 | Kept as zero in totals; medians use positive estimates only. |
| Island areas in the STATE column | 1,023 | 32 deaths. Reported separately, not ranked. |
| Records not keyed to a county (CZ_TYPE not C) | 0 | Excluded. Includes any marine zones. |
| Duplicate EVENT_ID | 0 | None found, so no record is counted twice. |
| Blank FLOOD_CAUSE | 0 | Would be shown as unknown. |
| Partial year 2026 | 1,709 | Excluded from every ranking; reported in one labelled note. |
Method
How we counted. We downloaded the NOAA NCEI Storm Events details files for 2015 to 2026 on 6 October 2026 and kept rows with EVENT_TYPE Flash Flood (45,915 rows, 2015 to 2025) and, for comparison, Flood (30,810 rows). Each row is one event in one county. Deaths are DEATHS_DIRECT plus DEATHS_INDIRECT summed over rows; a death is entered on one row, so summing rows does not double count, and Flash Flood and Flood rows are never added together. Episodes are grouped on EPISODE_ID. DAMAGE_PROPERTY strings such as 10.00K were converted to dollars; a blank would mean not estimated and be excluded, and none occur in the window. Damage is nominal and not inflation adjusted. Rankings cover the 50 states and DC; Puerto Rico, American Samoa, Guam and the Virgin Islands are reported separately. Rates per million divide 11 years of deaths by 2025 population from the Census Bureau Vintage 2025 estimates and are shown only for states with at least 10 deaths in the rate chart. 2026 is a partial year and is excluded from every ranking. Crop damage is not used.
Reproduce this
Reproduce this
- Endpoint
https://www.ncei.noaa.gov/pub/data/swdi/stormevents/csvfiles/- Query
StormEvents_details-ftp_v1.0_d{YEAR}_c{STAMP}.csv.gz for 2015 to 2026; keep EVENT_TYPE == 'Flash Flood' (and 'Flood' for the comparison); sum DEATHS_DIRECT + DEATHS_INDIRECT; parse DAMAGE_PROPERTY K/M/B suffixes- Rows retrieved
- 45,915 Flash Flood and 30,810 Flood rows, 2015 to 2025; 1,709 Flash Flood rows in the partial 2026 file
- Retrieved
- 6 October 2026
Files used, with the NCEI creation stamp (c) in each name: StormEvents_details-ftp_v1.0_d2015_c20260323.csv.gz, StormEvents_details-ftp_v1.0_d2016_c20260323.csv.gz, StormEvents_details-ftp_v1.0_d2017_c20260519.csv.gz, StormEvents_details-ftp_v1.0_d2018_c20260323.csv.gz, StormEvents_details-ftp_v1.0_d2019_c20260323.csv.gz, StormEvents_details-ftp_v1.0_d2020_c20260323.csv.gz, StormEvents_details-ftp_v1.0_d2021_c20260323.csv.gz, StormEvents_details-ftp_v1.0_d2022_c20260625.csv.gz, StormEvents_details-ftp_v1.0_d2023_c20260323.csv.gz, StormEvents_details-ftp_v1.0_d2024_c20260728.csv.gz, StormEvents_details-ftp_v1.0_d2025_c20260819.csv.gz, StormEvents_details-ftp_v1.0_d2026_c20260918.csv.gz. NCEI reissues a year’s file with a new c-stamp when records are corrected, so a later download may differ slightly. The 2026 file is partial. Column meanings follow the NCEI Storm Data bulk CSV format documentation.
What this does not show
What this does not show
- Recorded deaths, not all deaths. Storm Data is compiled by NWS offices from reports; a death not reported to or attributed by the office is absent. The direct or indirect call is a case-by-case judgement and, per NWS, not a legal determination.
- Event counts reflect reporting as well as weather. Offices differ in how actively they log Flash Flood events, so county and state event counts are not a pure measure of hazard.
- Damage is an estimate. Amounts are entered by NWS preparers from emergency managers, media and other sources, rounded to three significant digits, and stated in nominal dollars. A zero does not prove there was no damage.
- Rates are approximate. 11 years of deaths divided by one year’s population; visitors who died are counted where the event happened.
- No cause of death or circumstances. The details file carries counts only. NOAA’s separate fatalities file, which records age, sex and location type, was not used here.
- Not insurance claims or assistance. NFIP claims and FEMA grants are different datasets with different coverage.
Most quotable figures
- Texas recorded 338 of the 1,089 US Flash Flood deaths in NOAA Storm Events records from 2015 to 2025, 31% (NOAA NCEI).
- Kerr County, Texas, recorded 117 Flash Flood deaths in July 2025, more than any state other than Texas recorded in 11 years (NOAA NCEI).
- West Virginia has the highest Flash Flood death rate, 18.6 per million residents over 2015 to 2025 (NOAA NCEI, Census Vintage 2025).
- 86% of the $80.8 billion in reported Flash Flood property damage from 2015 to 2025 comes from just 10 weather episodes (NOAA NCEI).
- Per 1,000 event records, Flash Flood events carried 2.2 times as many deaths as Flood events, 2015 to 2025 (NOAA NCEI).
- 96% of Flash Flood deaths in 2015 to 2025 are classed as direct, caused by the water itself (NOAA NCEI).
Questions this report answers
Which state has the most flash flood deaths?
Texas, with 338 deaths in NOAA Flash Flood records from 2015 to 2025, followed by North Carolina with 105 (NOAA NCEI).
Which state has the highest flash flood death rate?
Among states with at least 10 deaths, West Virginia, at 18.6 deaths per million 2025 residents over 2015 to 2025 (NOAA NCEI, Census).
How many people die in flash floods in the US each year?
An average of 99 a year in NOAA records from 2015 to 2025, ranging from 37 in 2023 to 209 in 2025 (NOAA NCEI).
What is the difference between a flash flood and a flood?
In NWS Storm Data, a Flash Flood is a rapid, life-threatening rise of water beginning within minutes to multiple hours of the cause; a Flood is any damaging high flow, overflow or inundation, typically slower. They are separate event types (NWSI 10-1605).
How reliable are the flash flood damage figures?
They are estimates in nominal dollars. Only 33% of records carry an amount above zero, and 86% of the total sits in 10 episodes (NOAA NCEI).
Where can I find flash flood safety guidance?
From the National Weather Service, on its Turn Around Don’t Drown page. This report describes data only.
How to cite
Remediation Insider. Flash Flood Deaths by State: 11 Years of NOAA Storm Event Records. https://remediationinsider.com/flash-flood-deaths-by-state/ (retrieved 6 October 2026).
Data and tables in this report are released under CC BY 4.0. Attribution: Remediation Insider.
Sources
- NOAA National Centers for Environmental Information. NOAA NCEI Storm Events Database, bulk details files 2015 to 2026, csvfiles directory. Retrieved 6 October 2026.
- NOAA NCEI. NCEI Storm Data bulk CSV format documentation. Field definitions for DAMAGE_PROPERTY, FLOOD_CAUSE and fatality fields.
- National Weather Service. NWS Instruction 10-1605, Storm Data Preparation (26 July 2021). Definitions of Flash Flood and Flood (Appendix A, sections 14 and 15), direct and indirect fatalities (section 2.6) and damage estimates (section 2.7).
- National Weather Service. Turn Around Don’t Drown. Flood safety guidance.
- US Census Bureau Population Estimates, Vintage 2025. 2025 resident population, used for rates per million.
- No survey, interview or physical inspection was conducted for this report. Every figure is computed at build time from the retrieved public files.