The short answer
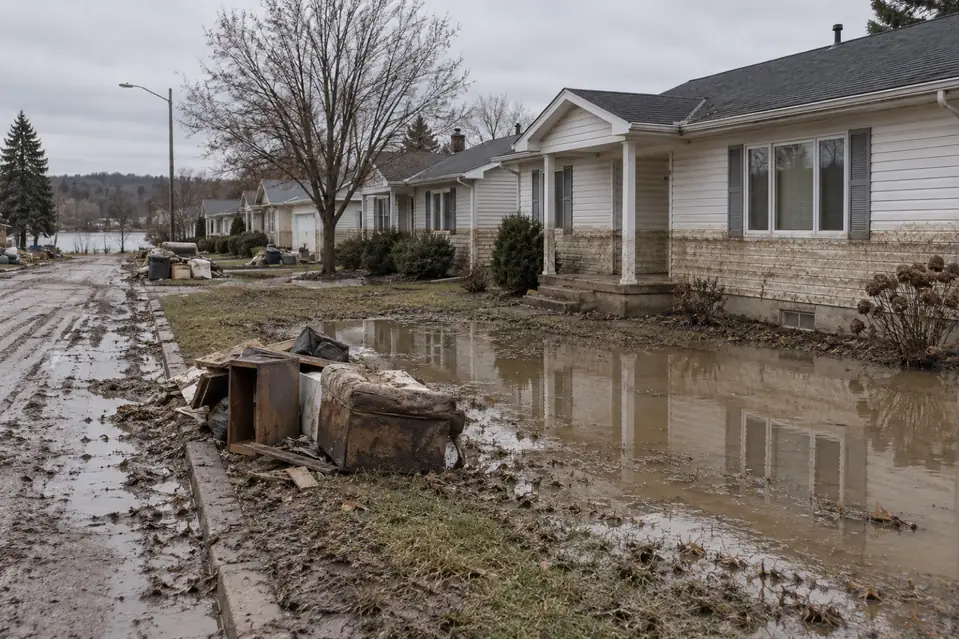
The flood facts most worth quoting come from three federal sources. According to NOAA’s National Weather Service, floods killed an average of 94 people a year in the United States from 1996 to 2025. FloodSmart says just 1 inch of floodwater can cause roughly $25,000 in damage to an average size home, and FEMA reports that nearly one-third of NFIP claims come from outside high-risk flood areas.
Key takeaways
- Flooding is the second deadliest weather hazard on the NWS 30-year average (94 deaths a year), behind heat (180), according to NOAA.
- The preliminary NOAA count for 2025 is 230 flood deaths, the highest annual total since 1972.
- Median NFIP building damage rises from $18,842 under one foot of water to $63,020 at two feet, per our FEMA claims analysis.
- FEMA’s figures for claims outside high-risk zones differ by period: 29% (2014 to 2024) against around 40% on a 2022 FloodSmart page.
- Only 2.89% of US homes carry an NFIP policy; the median county is at 0.44%, according to FEMA figures.
- NOAA’s billion-dollar record ends in 2024, with 45 flooding events costing $203.0 billion CPI-adjusted, per our report on it.
On this page
Most lists of facts about floods repeat the same lines without saying where they came from, and several of those lines have changed. This page numbers 28 flood statistics, gives each its own named source and flags where federal sources disagree. Our own FEMA and NOAA analyses are quoted exactly as each report states them; all of them sit on the data desk.
Out of scope: this page reports statistics, not insurance advice, and does not say what any policy pays. For your own property, check your policy wording, FloodSmart and your state insurance department. Health effects of floodwater are not covered; CDC is the federal source.
How common floods are
- 99% of US counties experienced a flood event between 2003 and 2023, according to FEMA’s NFIP Fast Facts sheet (November 2024).
- Nearly half of all US counties experienced a flood in the past five years, according to the FEMA FloodSmart What is a Flood page.
- 90% of all presidentially declared US natural disasters involve flooding, according to the FEMA FloodSmart home page.
- Flooding occurs in every US state and territory, per the NOAA NSSL flood basics, and every state and territory has had NFIP claims since 1980, according to FEMA’s FloodSmart claims history.
- A 100-year flood has a 1-percent chance of occurring in any given year, according to the USGS 100-year flood explainer, so it can happen two years running. FEMA’s FloodSmart flood risk page adds that over a 30-year mortgage, high-risk homes have a 1 in 4 chance of flooding at least once.
| Recurrence interval | Chance in any one year |
|---|---|
| 2-year | 50% |
| 10-year | 10% |
| 25-year | 4% |
| 50-year | 2% |
| 100-year | 1% |
| 500-year | 0.2% |
A 10-year flood is not one that arrives once a decade; it has a 10% chance every year, according to the USGS. A rare flood last spring does not lower the odds this spring.
Flood deaths
- Floods killed an average of 94 people a year from 1996 to 2025, according to the NWS 2025 fatality chart published by NOAA’s National Weather Service. Only heat, at 180, is higher.
- The 2016 to 2025 average is higher, at 118 a year, per the same NOAA chart, and the preliminary 2025 count of 230 is the highest since 1972, when the NWS 81-year table records 555.
- The NWS table records 8,991 flood deaths from 1940 to 2025, according to NOAA’s NWS 81-year table.
- More people die in floods each year than in tornadoes, hurricanes or lightning, according to the NOAA NSSL flood basics.
- Over half of all flood-related drownings occur when a vehicle is driven into hazardous flood water, according to the CDC as cited on the NWS Turn Around Don't Drown page.
- Flash floods are deadlier per event. NOAA Storm Events records log 1,089 Flash Flood deaths from 2015 to 2025, and 23.7 deaths per 1,000 event records against 10.8 for the Flood type, per our flash flood deaths by state report. Texas holds 338, or 31%, per NOAA.

| Hazard | 2025 (preliminary) | 10-year average | 30-year average |
|---|---|---|---|
| Heat | 100 | 279 | 180 |
| Flood | 230 | 118 | 94 |
| Wind | 55 | 57 | 78 |
| Tornado | 67 | 51 | 73 |
| Hurricane | 0 | 25 | 50 |
| Winter | 10 | 27 | 33 |
| Lightning | 20 | 19 | 31 |
| Cold | 25 | 35 | 30 |
Two cautions. The NWS figures come from Storm Data, and the NWS says the CDC is the official source for cause of death, so the two counts are not interchangeable. And hurricane deaths are wind only: surge and rain drownings are filed under Flood, according to the NWS weather fatality statistics page.
What a little water costs
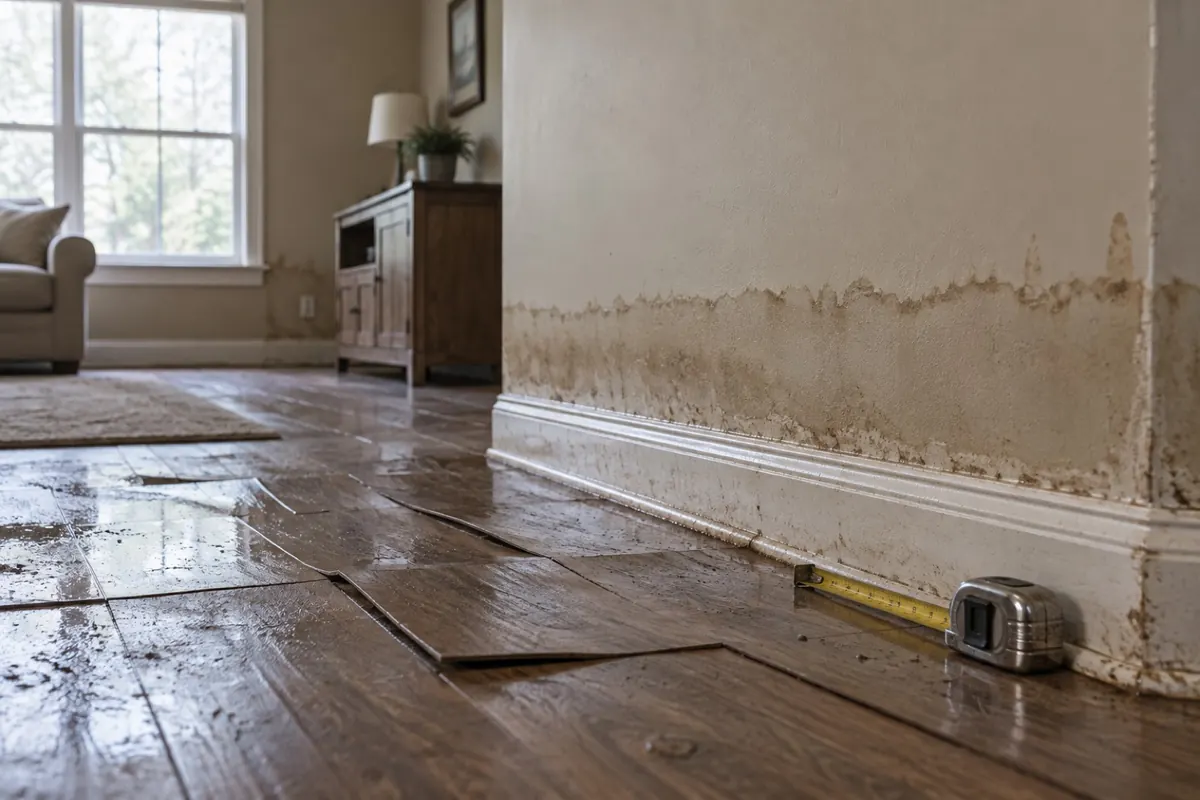
- “Just 1 inch of floodwater can cause roughly $25,000 in damage to an average size home.” That is the exact wording on FEMA’s FloodSmart 13 Fast Flood Facts (October 2022). FEMA’s May 2023 FloodSmart Five Facts says “up to $25,000”. Neither publishes a method.
- Median NFIP building damage is $18,842 under one foot of water, $41,296 at one foot and $63,020 at two feet, according to our water depth damage curve, built from FEMA claims since 2015. That is a 3.3 times rise.
- Above about three feet the damage curve flattens. Median damage at five feet is $68,449, close to the two foot figure, per the same FEMA-based water depth damage curve.
- 42.3% of NFIP claims since 2015 are coded as a combination of causes including sewer backup, the largest cause category, per the water depth damage curve analysis of FEMA data.
- The average NFIP claim payment was $52,000 from 2019 to 2023, according to FEMA’s NFIP Fast Facts sheet. FEMA’s FloodSmart flood risk page reports a different window and a higher figure: $82,614 average payment for all claims from 2020 to 2024.
| Source | What it says | Basis |
|---|---|---|
| FEMA FloodSmart agent page (October 2022) | Just 1 inch of floodwater can cause roughly $25,000 in damage to an average size home. | No method stated |
| FEMA FloodSmart article (May 2023) | Just one inch of water in a typical home can cause up to $25,000 of damage. | No method stated |
| Remediation Insider, FEMA NFIP claims since 2015 | Median building damage under one foot of water: $18,842 | 403,505 cleaned claims |
The FloodSmart line is an awareness figure with no stated method; the FEMA claims medians describe assessed insured losses. Quote the one that fits the question, and name it.
Flood zones and flood insurance
- Nearly one-third of NFIP claims (29%) came from outside high-risk flood areas from 2014 to 2024, according to FEMA’s FloodSmart flood risk page. Our flood zone exposure report finds 28.6% since 2015.
- Floods caused more than $8 billion of damage to homes and businesses in 2024, and $3.8 billion of it occurred in communities that are not considered high-risk, according to FEMA as cited on the FloodSmart Cost of Flooding page.
- Only 2.89% of US residential structures carry an NFIP policy: 3,160,864 policies against 109,326,879 structures, per the FEMA figures in our flood insurance take-up map.
- The typical county is far below the national rate. The median county take-up is 0.44%, and 2,379 of 3,144 counties are under 1%, according to the FEMA data in our flood insurance take-up map.
- NFIP policies generally have a 30-day waiting period, according to FEMA’s NFIP Fast Facts sheet.
- NFIP residential building coverage tops out at $250,000, according to FEMA. Of 16,952 claims assessed above that figure, 94.3% settle at or within $1,000 of it, and only 35.2% of claims since 2015 record any contents payment, per our flood loss gap report built on FEMA claims.
| Source | Period | Share of claims outside high-risk zones |
|---|---|---|
| FloodSmart flood risk page | 2014 to 2024 | Nearly one-third (29%) |
| NFIP Fast Facts infographic (Nov 2024) | 2013 to 2023 | One-third |
| FloodSmart 13 Fast Flood Facts (Oct 2022) | Not stated | Around 40% |
| Remediation Insider flood zone exposure report | Loss years 2015 on | 28.6% of claims with a rated zone |
Our flood zone exposure report adds a selection effect: cover outside the zone is optional and rare, so the claim share almost certainly understates the out-of-zone share of flood losses.
| Where | NFIP residential take-up |
|---|---|
| Inside the mapped high-risk zone (SFHA) | 43.9% |
| Outside the mapped zone | 1.25% |
| All US residential structures (pooled) | 2.89% |
| Median county | 0.44% |
| Highest state, Louisiana | 22.0% |
| Lowest state, Minnesota | 0.23% |
Where flood claims concentrate
- Florida, Texas and Louisiana hold 67.8% of NFIP building claims since 2015, per FEMA data. Florida alone filed 153,321, which is 31.2% of 491,235 claims, according to our flood claims by state report built on FEMA OpenFEMA data.
- Per head, Louisiana leads at 1,298 claims per 100,000 residents, roughly double Florida’s 656, per the same FEMA-based flood claims by state report, which reports median damage per claim from $5,536 in Colorado to $55,416 in Texas.
The billion-dollar record
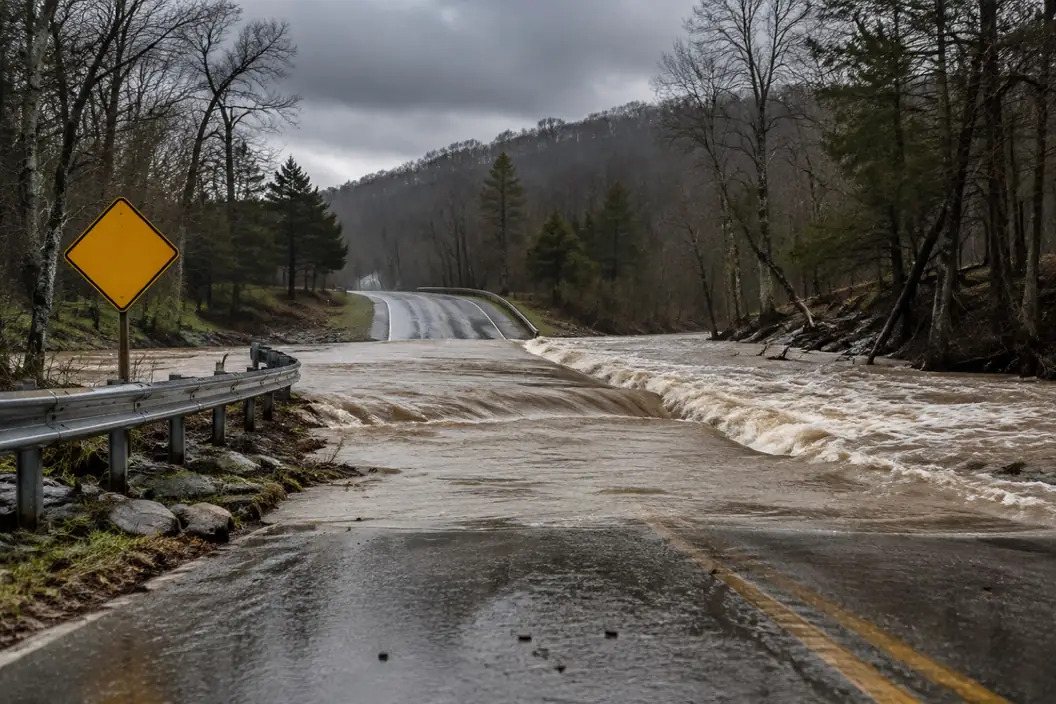
- NOAA lists 45 flooding events of $1 billion or more from 1980 to 2024, costing $203.0 billion CPI-adjusted, with 765 deaths, according to the NOAA file analysed in our billion-dollar disaster record. Across all types the NOAA record holds 403 events and $2,917.6 billion.
- There is no NOAA billion-dollar count for 2025. NOAA retired the product on 8 May 2025 and the final file ends in 2024, per our billion-dollar disaster record. A 2025-named file on the NOAA server repeats the 2024 data byte for byte.
Most flood losses fall below $1 billion and never appear in this NOAA record.
How big floods get
- Storm tides can reach 20 feet or more when storm surge coincides with normal high tide, according to the NOAA NSSL flood types. In 1889 a dam break upstream of Johnstown, Pennsylvania, released a 30 to 40 foot wall of water that killed 2,200 people, per the NOAA NSSL flood basics.
- A creek only 6 inches deep in mountainous areas can swell to a 10-foot deep raging river in less than an hour if a thunderstorm lingers, according to the NOAA NSSL flood basics. The USGS adds that flash floods generally cause greater loss of life and river floods greater loss of property (USGS flood types FAQ).
Before you quote a flood fact
Run this five-step check before a flood statistic goes into a report, proposal or client email.
- Find the publisher. Trace the number to NOAA, USGS, FEMA or the dataset.
- Write down the period. Both FEMA shares above are real; they differ by date.
- Keep the hedge words. Roughly, up to, fast-moving, most cars.
- Name the measure. Average, median, pooled rate or county median.
- Check the series still exists. NOAA’s billion-dollar product stopped at 2024.
| Commonly shared line | What the source says | How to quote it |
|---|---|---|
| Floods are the deadliest weather hazard | Heat has the higher NWS 30-year average (180 against 94). | Say “second only to heat”. |
| One inch of water causes $25,000 of damage | FEMA FloodSmart says “roughly” (2022) and “up to” (2023). | Keep the hedge word. |
| A third of flood claims are outside flood zones | FEMA says 29% for 2014 to 2024; an older page says around 40%. | Give the period. |
| Six inches of water can knock you down | NWS says 6 inches of fast-moving water can knock over an adult. | Keep “fast-moving”. |
| NOAA counted X billion-dollar disasters in 2025 | NOAA’s series ends in 2024. | Do not cite a NOAA 2025 count. |
| About 3% of homes have flood insurance | FEMA data give 2.89% pooled; the median county is 0.44%. | Name which rate you mean. |
For contractors: what the numbers change on a flood job
For a restoration firm these statistics are scoping inputs. The S500 definition of Category 3 water, quoted in the IICRC S500 position statement (February 2026), lists “rising water from rivers or streams” among its examples, though the statement adds that weather-related water is not automatically Category 3; the restorer decides after inspection. FEMA’s FloodSmart documentation page asks for photos before cleaning and kept samples of damaged materials, the evidence an adjuster will expect the contractor to preserve.
| Fact | Source figure | What it changes |
|---|---|---|
| River or stream water inside | An S500 Category 3 example | Category, PPE, what stays |
| Loss value sits low | Median damage rises 3.3 times over two feet (FEMA data) | Flooring, lower drywall, cabinets |
| Contents bought separately | 35.2% of claims record a contents payment (FEMA data) | Split line items early |
| $250,000 building limit | 94.3% of claims above it settle near it (FEMA data) | Funding beyond the policy |
| Mold timing | EPA: dry within 24 to 48 hours | Mobilisation speed, drying logs |
| Documentation | FloodSmart: photos before cleaning, samples | Photo log, kept samples |
None of this says what a policy pays; the policy wording and the carrier decide that.
Questions people actually ask
What are 5 interesting facts about floods?
Floods killed 94 people a year on the NWS 1996 to 2025 average; 99% of US counties had a flood event from 2003 to 2023, per FEMA; a 100-year flood has a 1% chance every year, per USGS; 6 inches of fast-moving water can knock over an adult, per NWS; and nearly one-third of NFIP claims come from outside high-risk zones, per FEMA.
How tall can a flood get?
It depends on the type. NOAA’s National Severe Storms Laboratory says storm tides can reach 20 feet or more when surge meets high tide, and that the 1889 Johnstown dam break released a 30 to 40 foot wall of water. A 6 inch mountain creek can become a 10 foot torrent in under an hour.
How many people die in floods each year in the US?
NOAA’s National Weather Service puts the 30-year average at 94 flood deaths a year (1996 to 2025) and the 10-year average at 118. Its preliminary 2025 count is 230, the highest annual total since 1972. Hurricane surge and rain drownings are filed under Flood in these tables.
What are the main effects of floods?
Federal sources list deaths, mostly in vehicles and people walking into water (NWS, citing CDC); building damage concentrated in the first two feet of water (FEMA claims); contamination of floodwater with sewage and chemicals (NWS); outages and damaged roads (Ready.gov); and uninsured losses, since 2.89% of US homes carry an NFIP policy (FEMA data).
Does flood insurance cover homes outside flood zones?
NFIP cover can be bought in any participating community regardless of flood zone, according to FloodSmart, and is mandatory only for government-backed mortgages in high-risk zones. What a specific policy pays depends on its wording; check it with the carrier, a licensed agent and your state insurance department.
Does one inch of floodwater really cause $25,000 of damage, as FEMA says?
It is a FEMA FloodSmart figure: “Just 1 inch of floodwater can cause roughly $25,000 in damage to an average size home.” No method is published with it. FEMA claims data analysed by Remediation Insider show median building damage of $18,842 under one foot of water since 2015.
Sources
- NWS weather fatality statistics, NWS 2025 fatality chart and NWS 81-year table, NOAA National Weather Service; 2025 preliminary. Retrieved 18 October 2026.
- NWS Turn Around Don't Drown page and NWS flood safety page, NOAA National Weather Service. Retrieved 18 October 2026.
- NOAA NSSL flood basics and NOAA NSSL flood types, NOAA NSSL. Retrieved 18 October 2026.
- USGS 100-year flood explainer and USGS flood types FAQ, U.S. Geological Survey. Retrieved 18 October 2026.
- FloodSmart 13 Fast Flood Facts (October 2022) and FloodSmart Five Facts (May 2023), FEMA NFIP agent site. Retrieved 18 October 2026.
- NFIP Fast Facts sheet, FEMA NFIP, November 2024. Retrieved 18 October 2026.
- FloodSmart flood risk page, FloodSmart What is a Flood, FloodSmart Cost of Flooding, FloodSmart claims history, FloodSmart home page and FloodSmart documentation page, FEMA FloodSmart, undated. Retrieved 18 October 2026.
- Ready.gov floods page, FEMA Ready.gov. Retrieved 18 October 2026.
- IICRC S500 position statement, 10 February 2026, citing ANSI/IICRC S500 (2021). Retrieved 18 October 2026.
- EPA mold and moisture guide, US EPA. Retrieved 18 October 2026.
- Remediation Insider research, quoted as stated and not recomputed: flood claims by state report, water depth damage curve, flood zone exposure report, flood insurance take-up map, flash flood deaths by state report, flood loss gap report, billion-dollar disaster record. Read 18 October 2026.
- Only the NWS flood fatality column is summed here, from printed values. See our methodology.
This product uses the Federal Emergency Management Agency’s OpenFEMA API, but is not endorsed by FEMA. The Federal Government or FEMA cannot vouch for the data or analyses derived from these data after the data have been retrieved from the Agency’s website(s).