The finding
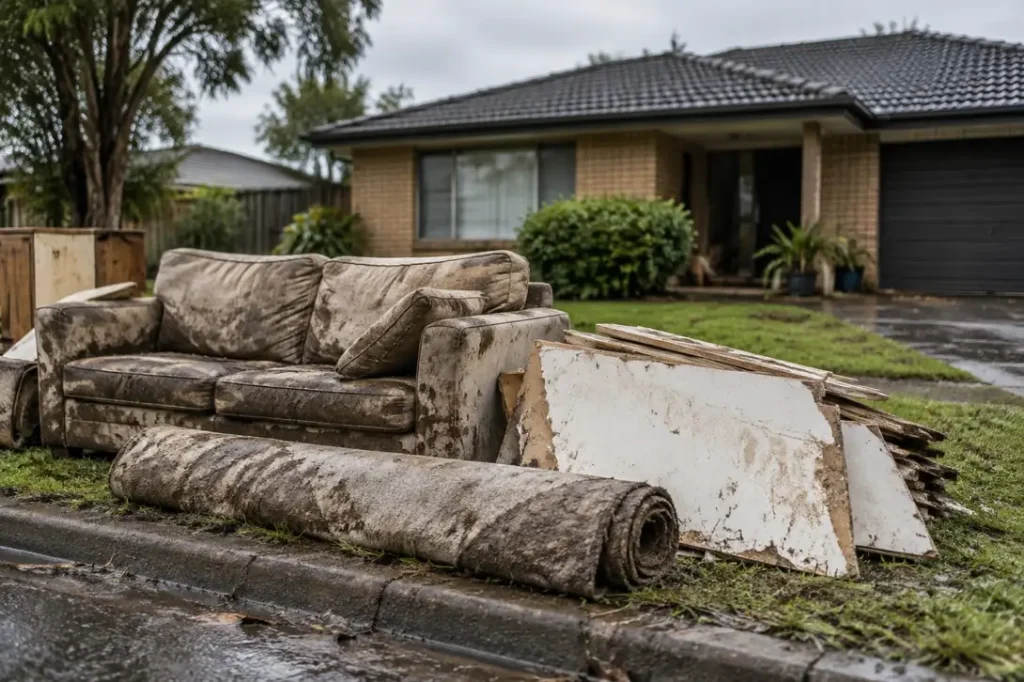
Ask how many disaster victims have insurance and FEMA’s own registration file gives three answers, depending on who you count. Across 6,367,334 FEMA registrants in 8 large disasters declared 2017 to 2021 (registrations, not people), 29.9% reported homeowners insurance (56.4% among owners, since renters rarely hold it) and 9.8% reported flood insurance. Among owners whose homes FEMA inspected and found water inside, 73.7% had no flood policy, and 87,901 of them held a homeowners policy that, in most cases, does not cover flood.
Headline figures
In this report
- Three denominators, three answers
- Homeowners insurance is not flood insurance
- Disaster by disaster
- Puerto Rico after Maria
- Deeper water, more flood policies
- What inspectors recorded, and what FEMA paid
- Income draws the line
- Mobile homes and travel trailers
- Renters: a near-empty column
- Two flood measures that disagree
- Method
- Reproduce this
- What this does not show
- Questions this report answers
- Sources
Key findings
- Of 6,367,334 registrations in the FEMA large disasters file, 4,330,800 (68.0%) reported neither homeowners nor flood insurance (FEMA OpenFEMA).
- In the 7 hurricane declarations, FEMA inspectors recorded water inside 225,739 owner-registered homes. 166,377 of them (73.7%) had no flood insurance (FEMA OpenFEMA).
- 87,901 of those flooded owner homes (38.9%) had a homeowners policy but no flood policy, the exact gap FloodSmart warns about. A further 78,476 (34.8%) had neither (FEMA OpenFEMA).
- Flood insurance among flooded owner homes ranged from 9% after Hurricane Maria to 39% after Hurricane Michael (FEMA OpenFEMA, inspected registrations).
- Only 22% of owner registrations after Hurricane Maria in Puerto Rico reported homeowners insurance, against 63% to 74% in every other disaster in the file (FEMA OpenFEMA).
- Flood insurance rises with water depth: 17.7% of owners with 1 to 6 inches of water held a policy, against 42.1% with more than 48 inches (FEMA OpenFEMA, inspected registrations).
- Among flooded owner homes, 68.0% of those without flood insurance received a FEMA repair award (median $8,817), against 12.4% of those with it (FEMA OpenFEMA).
- Just 6.6% of flooded mobile home owners had flood insurance, against 29.7% of flooded house and duplex owners (FEMA OpenFEMA).
Three denominators, three answers
The FEMA file holds 6,367,334 registrations from 8 major disaster declarations. A household that applies once for one disaster is one row. The same household can appear again under another disaster, and one row can stand for a family of several people. So every rate below is a share of registrations, and the phrase disaster victims in this report always means FEMA registrants.
Who goes into the denominator decides the answer. Counting every registration, renters included, gives the lowest insurance rates. Counting owners only raises the homeowners figure. Counting only owners whose homes FEMA inspectors found with water inside answers the question most readers mean: did the people who flooded have a policy that pays for flooding? Source: FEMA OpenFEMA.
| Who is counted | Registrations | Homeowners insurance | Flood insurance |
|---|---|---|---|
| Every registration | 6,367,334 | 29.9% | 9.8% |
| Owner registrations | 3,344,330 | 56.4% | 16.7% |
| Renter registrations | 3,004,390 | 0.5% | 2.1% |
| Inspected owners with water inside, 7 hurricanes | 225,739 | 62.4% | 26.3% |
Homeowners insurance is not flood insurance
FEMA’s flood insurance site, FloodSmart, puts it in one line: “Most homeowners insurance does not cover flood damage.” That sentence is why the homeowners figure on its own overstates protection. A registrant who ticks yes for homeowners insurance may still have no cover for water that came in from outside.
Of 225,739 owner homes with water inside, 59,362 (26.3%) reported flood insurance. 87,901 (38.9%) reported a homeowners policy and no flood policy, and 78,476 (34.8%) reported neither. Put plainly, the largest single group of flooded owners in these files had insurance, just not the kind that matches the loss. Source: FEMA OpenFEMA.
For restoration contractors this changes the first conversation on a flood job. In these 7 hurricanes, a flooded owner who mentions insurance was more likely to hold a homeowners policy without flood cover than a flood policy. Whether any given policy responds is a question for the policy wording and the insurer, not for a dataset. State-level flood policy counts are in our flood insurance take-up map, and the gap between insured and total flood loss is in the insured flood loss gap report. Source: FEMA OpenFEMA.
Disaster by disaster
The file covers 8 declarations, named here from FEMA’s declaration summaries rather than from memory. For each one the table gives registrations, the owner share, homeowners insurance among owners, flood insurance among every registration, and flood insurance among inspected owners and renters with water inside. Source: FEMA OpenFEMA.
| Disaster | Registrations | Owners | Owners with homeowners insurance | Flood insurance, all | Flooded owners with flood insurance | Flooded renters with flood insurance |
|---|---|---|---|---|---|---|
| Hurricane Harvey (Texas, 2017) | 895,636 | 50% | 63% | 11% | 32% of 143,326 | 4% of 71,217 |
| Hurricane Irma (Florida, 2017) | 2,644,446 | 46% | 67% | 9% | 14% of 29,200 | 1% of 34,251 |
| Hurricane Maria (Puerto Rico, 2017) | 1,122,627 | 69% | 22% | 3% | 9% of 21,157 | 1% of 7,340 |
| Hurricane Florence (North Carolina, 2018) | 139,818 | 62% | 70% | 8% | 23% of 20,897 | 2% of 6,685 |
| Hurricane Michael (Florida, 2018) | 103,286 | 63% | 66% | 9% | 39% of 1,831 | 3% of 767 |
| Hurricane Laura (Louisiana, 2020) | 226,859 | 50% | 66% | 8% | 17% of 1,508 | 1% of 4,648 |
| Severe Winter Storms (Texas, 2021) | 417,717 | 50% | 63% | 3% | Not a flood event | Not a flood event |
| Hurricane Ida (Louisiana, 2021) | 816,945 | 53% | 74% | 26% | 27% of 7,820 | 3% of 11,035 |
Hurricane Michael in Florida had the highest flood insurance rate among flooded owners, 39.1%, though on a small base of 1,831 homes. Hurricane Maria had the lowest, 9.5% of 21,157. These rates describe the people who applied to FEMA, not every home in the area: a household with full flood cover may never register. Source: FEMA OpenFEMA.
One declaration is left out of every flood comparison: Severe Winter Storms in Texas (February 2021, declared as a Severe Ice Storm, 49 owner homes with water inside). That declaration was not a flood or hurricane event, so water recorded inside those homes cannot be read as flood water, and a flood insurance rate there would compare unlike losses. Its registrations stay in the all-registration figures. Source: FEMA OpenFEMA.
Puerto Rico after Maria
Hurricane Maria produced 1,122,627 registrations in Puerto Rico, 69% of them from owners, the highest owner share in the file. Only 21.7% of those owners reported homeowners insurance. In the other 7 declarations the homeowners insurance rate among owners never fell below 62.9%. Flood insurance was reported on 3.0% of all Puerto Rico registrations and by 9.5% of the 21,157 inspected owner homes with water inside. Source: FEMA OpenFEMA.
FEMA’s dataset description notes that Puerto Rico addresses do not match well with standard geocoders, which affects location fields. The insurance flags are answers given at registration and are not affected by geocoding. The Puerto Rico figures should still be read as registrant answers, not as an island-wide insurance rate. Source: FEMA OpenFEMA.
Deeper water, more flood policies
FEMA’s data dictionary describes the waterLevel field as “Total depth of water in damaged dwelling” and does not state a unit. The recorded values point to inches: values of 12, 24, 36 and 48 occur 3.6 times as often as the values one either side of them, the rounding pattern expected when inspectors record whole feet in inches. We treat the field as inches on that basis. The tail is doubtful: 558 values exceed 120 inches (10 feet), and the largest, 660, would be 55 feet of water inside a home. Those values stay in the open-ended top band. Source: FEMA OpenFEMA.
The deeper the water, the more likely the owner held flood insurance: from 17.7% at 1 to 6 inches to 42.1% above 48 inches. A likely reading is location: homes that take deep water tend to sit in mapped flood zones where lenders require a policy, while shallow water reaches homes outside them. The file has no flood zone field, so this reading cannot be tested here; our water depth damage curve covers depth from the NFIP side. Source: FEMA OpenFEMA.
| Water inside (inches) | Owner homes | With flood insurance | Median verified real property loss, insured | Median, not insured |
|---|---|---|---|---|
| 1 to 6 | 92,114 | 17.7% | $7,325 | $2,164 |
| 7 to 12 | 40,703 | 27.4% | $11,289 | $7,745 |
| 13 to 24 | 46,927 | 31.5% | $14,170 | $9,437 |
| 25 to 48 | 33,190 | 35.6% | $21,362 | $13,282 |
| More than 48 | 12,805 | 42.1% | $32,479 | $22,014 |
What inspectors recorded, and what FEMA paid
Two inspection fields carry dollar losses. The data dictionary defines rpfvl as “Real property damage amount observed by FEMA” and ppfvl as “FEMA Verified Loss captured during inspection of personal property”. Across flooded owner homes, the median real property loss was $12,982 with flood insurance and $5,360 without, a ratio of 2.4. Source: FEMA OpenFEMA.
Depth is part of the story: insured homes sit deeper in the water, as the depth table above shows. It is not all of it. Within each of the 5 depth bands the insured median is still 1.5 to 3.4 times the uninsured median, against 2.4 times pooled. The file holds no home value, construction or flood zone field, so it cannot say why. Personal property moves the other way: the median personal property loss was $2,470 for insured owners and $2,559 for uninsured owners. Source: FEMA OpenFEMA.
| Flooded owner homes | Registrations | Habitability repairs required | Received a FEMA repair award | Median repair award |
|---|---|---|---|---|
| With flood insurance | 59,362 | 89.5% | 12.4% | $550 |
| Without flood insurance | 166,377 | 76.7% | 68.0% | $8,817 |
FEMA’s dataset description says its grants can help pay for “emergency home repairs, uninsured and underinsured personal property losses”. The award pattern fits that: 68.0% of flooded owners without flood insurance received a repair award, with a median of $8,817, against 12.4% of flooded owners with flood insurance. A FEMA repair award is a grant, not an insurance settlement, and its size is not a repair estimate. The disaster grant ledger tracks those grants by disaster, and the SBA disaster loan report covers the loans that follow. Source: FEMA OpenFEMA.
Income draws the line
Gross income in the file is self-reported at registration. 1,169,713 registrations left it blank and 89,729 reported $0; both are shown as their own rows and kept out of the medians. Among owners who gave a positive income, the median was $50,000 for those with homeowners insurance and $19,248 for those without. Source: FEMA OpenFEMA.
| Self-reported gross income | Owner registrations | Homeowners insurance | Flooded owner homes | Flooded owners with flood insurance |
|---|---|---|---|---|
| $0 reported | 49,564 | 41.7% | 1,809 | 22.0% |
| $1 to $14,999 | 591,513 | 24.1% | 37,037 | 10.0% |
| $15,000 to $29,999 | 604,948 | 44.9% | 40,011 | 15.7% |
| $30,000 to $49,999 | 568,055 | 64.1% | 38,277 | 23.4% |
| $50,000 to $74,999 | 420,969 | 77.8% | 30,660 | 31.4% |
| $75,000 to $99,999 | 222,797 | 86.2% | 17,632 | 37.8% |
| $100,000 to $149,999 | 187,158 | 91.1% | 16,781 | 46.2% |
| $150,000 or more | 130,279 | 87.5% | 14,690 | 58.1% |
| Not reported | 569,047 | 49.7% | 28,842 | 25.8% |
Homeowners insurance climbs from 24.1% of owners reporting $1 to $14,999 to 91.1% at $100,000 to $149,999. Flood insurance among flooded owners climbs from 10.0% to 58.1% at $150,000 or more. The top band is the only one where a majority of flooded owners held flood insurance. Income and insurance move together in this file; the file cannot show whether income, mortgage status or location drives the pattern. Source: FEMA OpenFEMA.
Mobile homes and travel trailers
Owners of mobile homes reported homeowners insurance at 33.7%, against 61.2% for house and duplex owners. Among inspected owner homes with water inside, 6.6% of 29,499 mobile homes had flood insurance, against 29.7% of 186,693 houses and duplexes. Source: FEMA OpenFEMA.
| Residence type | Owner registrations | Homeowners insurance | Flooded owner homes | Flooded with flood insurance |
|---|---|---|---|---|
| House/Duplex | 2,632,322 | 61.2% | 186,693 | 29.7% |
| Mobile Home | 309,704 | 33.7% | 29,499 | 6.6% |
| Townhouse | 146,040 | 44.3% | 2,959 | 35.1% |
| Other | 108,968 | 35.2% | 250 | n/a |
| Condo | 107,467 | 54.8% | 2,451 | 27.9% |
| Travel Trailer | 27,713 | 14.9% | 3,398 | 4.0% |
| Apartment | 8,875 | 31.3% | 372 | n/a |
| Boat | 3,085 | 24.6% | 117 | n/a |
Travel trailer owners reported homeowners insurance at 14.9%. Among residence types with at least 1,000 flooded owner homes, the lowest flood insurance rates were travel trailer (4.0%) and mobile home (6.6%). Source: FEMA OpenFEMA.
Renters: a near-empty column
Renters made up 3,004,390 registrations. Only 0.5% carried the homeowners insurance flag and 2.1% the flood insurance flag. The data dictionary labels the first field “Does the applicant have Home Owner’s Insurance” and does not say whether a renters policy counts, so the file offers no usable measure of renters’ contents insurance and we do not infer one. Source: FEMA OpenFEMA.
Among 135,943 inspected renter registrations with water inside in the hurricane declarations, 3,642 (2.7%) reported flood insurance. Their median personal property loss, where above zero, was $2,004 without flood insurance (n = 100,456). Owner and renter damage are compared in more depth in the owner and renter damage gap report. Source: FEMA OpenFEMA.
Two flood measures that disagree
The file carries a floodDamage flag, but FEMA’s data dictionary now describes it this way: “Due to inconsistencies with other data, this field is being deprecated and will no longer appear in this data set.” In the hurricane declarations, 55,238 inspected registrations had water recorded inside but no flood flag, and 4,679 had the flag but no water level. This report therefore uses water inside (a water level above zero) as its flood measure and shows the flag only as a cross-check. Source: FEMA OpenFEMA.
| Disaster | Owners with water inside | With flood insurance | Owners flagged floodDamage | With flood insurance |
|---|---|---|---|---|
| Hurricane Harvey (Texas, 2017) | 143,326 | 31.6% | 135,070 | 32.9% |
| Hurricane Irma (Florida, 2017) | 29,200 | 14.0% | 27,681 | 14.1% |
| Hurricane Maria (Puerto Rico, 2017) | 21,157 | 9.5% | 20,095 | 9.6% |
| Hurricane Florence (North Carolina, 2018) | 20,897 | 23.4% | 17,837 | 25.6% |
| Hurricane Michael (Florida, 2018) | 1,831 | 39.1% | 1,729 | 40.9% |
| Hurricane Laura (Louisiana, 2020) | 1,508 | 16.9% | 1,259 | 18.4% |
| Hurricane Ida (Louisiana, 2021) | 7,820 | 26.8% | 5,919 | 29.3% |
Method
How we counted. We retrieved every row of FEMA’s Individual Assistance Housing Registrants, Large Disasters dataset (version 1) from the OpenFEMA API on 6 October 2026: 6,367,334 registrations with unique ids across 8 disaster numbers. FEMA’s own count for each disaster matched the rows retrieved, and a count filtered on disasterNumber gt 0 returns the same total. The unfiltered count the API reports is 6,400,532, which is 33,198 higher; no query we ran returns those 33,198 rows, so we treat 6,367,334 as the complete retrievable file and say so here. FEMA’s dataset metadata states that no new disasters will be added to this file and that it includes invalid as well as valid registrants. Disaster names, states, dates and incident types come from DisasterDeclarationsSummaries v2, joined on disaster number. Insurance flags (homeOwnersInsurance, floodInsurance) are self-reported at registration and are used for every row. Inspection fields (waterLevel, rpfvl, ppfvl, habitabilityRepairsRequired, floodDamage) are used only where inspected is True; 3,114,662 registrations (48.9%) were inspected. Uninspected rows carrying a flood flag or a loss amount: 0. Flooded means inspected with waterLevel above zero, read as inches. Declarations whose incident type is not a hurricane, flood, coastal storm or tropical storm (1 in this file) are excluded from flood comparisons. Loss medians use values above zero; negative loss values found: 0. 18,614 registrations with tenure Unknown are excluded from owner and renter splits. Income is banded; 1,169,713 blank and 89,729 zero incomes are reported separately; invalid income values found: 0. The data was aggregated in memory in a single pass; no figure was typed by hand.
Reproduce this
Reproduce this
- Endpoint
https://www.fema.gov/api/open/v1/IndividualAssistanceHousingRegistrantsLargeDisasters- Query
$select=id,disasterNumber,damagedStateAbbreviation,damagedZipCode,ownRent,residenceType,householdComposition,grossIncome,homeOwnersInsurance,floodInsurance,inspected,rpfvl,ppfvl,habitabilityRepairsRequired,destroyed,waterLevel,floodDamage,repairAmount,renterDamageLevel,primaryResidence&$orderby=id&$top=10000&$skip=0,10000,20000,...- Rows retrieved
- 6,367,334 registrations
- Retrieved
- 6 October 2026
No API key is required. Page with $top and $skip, ordered by id, and check unique ids against $inlinecount=allpages per disaster. With $filter=disasterNumber gt 0 the count is 6,367,334; without a filter it reads 6,400,532. Booleans arrive as True or False; a blank is a null. Field definitions are in the OpenFEMA data dictionary.
Reproduce this
- Endpoint
https://www.fema.gov/api/open/v2/DisasterDeclarationsSummaries- Query
$select=disasterNumber,state,declarationType,incidentType,declarationDate,declarationTitle- Rows retrieved
- 8 disaster numbers joined
- Retrieved
- 6 October 2026
Used for names, states, dates and incident types only.
What this does not show
What this does not show
- Registrations, not people or homes. One row is one application to FEMA for one disaster. A household can appear under more than one disaster.
- Only people who applied. Households with full insurance cover may never register with FEMA, so these rates describe applicants, not every home in the disaster area.
- Self-reported insurance. The flags are answers given at registration. The file does not say what a policy covered, its limits, or whether a claim was paid.
- Inspected subset only for damage. Water, loss and habitability fields exist only for the 48.9% of registrations FEMA inspected. Counts of flooded homes are a floor.
- Water level units are inferred. The dictionary gives no unit; the inches reading rests on the rounding pattern described above.
- Eight disasters, not all disasters. FEMA curated this file from some of the largest events. It is not a national sample.
- No flood zone, mortgage or premium fields. The file cannot show why a registrant did or did not hold flood insurance.
Most quotable figures
- 166,377 owner homes that FEMA inspectors found with water inside after 7 hurricanes had no flood insurance, 73.7% of the total (FEMA OpenFEMA).
- 38.9% of flooded owner homes in FEMA’s large disaster file had homeowners insurance but no flood insurance (FEMA OpenFEMA, n = 225,739).
- Only 9.8% of 6,367,334 FEMA disaster registrations reported flood insurance (FEMA OpenFEMA).
- After Hurricane Maria, 22% of owner registrants in Puerto Rico reported homeowners insurance (FEMA OpenFEMA).
- 68% of flooded owners without flood insurance received a FEMA repair award, median $8,817 (FEMA OpenFEMA).
- Flooded mobile home owners held flood insurance at 6.6%, against 29.7% for houses (FEMA OpenFEMA).
Questions this report answers
How many disaster victims have insurance?
In FEMA’s large disasters file, 32.0% of 6,367,334 registrations reported homeowners or flood insurance: 29.9% homeowners and 9.8% flood. Among inspected owners with water inside, 26.3% had flood insurance (FEMA OpenFEMA).
Does homeowners insurance cover flood damage?
FloodSmart, FEMA’s flood insurance site, says “Most homeowners insurance does not cover flood damage.” Check the policy wording with the insurer, and see FloodSmart.gov or your state insurance department.
Why count registrants instead of people?
Because each row in the FEMA file is an application. One application can cover several people, and one household can apply in more than one disaster.
Which disaster had the lowest homeowners insurance rate?
Hurricane Maria in Puerto Rico: 21.7% of owner registrations. The highest was Hurricane Ida in Louisiana at 73.9% (FEMA OpenFEMA).
Do flooded renters have flood insurance?
Rarely in this file: 2.7% of 135,943 inspected renter registrations with water inside reported it (FEMA OpenFEMA).
Can I reuse these figures?
Yes, under CC BY 4.0 with attribution to Remediation Insider. The underlying records are public on OpenFEMA.
How to cite
Remediation Insider. How Many Disaster Victims Have Insurance? 6.37M FEMA Registrants. https://remediationinsider.com/disaster-insurance-gap-report/ (retrieved 6 October 2026).
Data and tables in this report are released under CC BY 4.0. Attribution: Remediation Insider.
Sources
- Federal Emergency Management Agency. Individual Assistance Housing Registrants, Large Disasters, v1. OpenFEMA API, 6,367,334 records retrieved 6 October 2026.
- Federal Emergency Management Agency. OpenFEMA data dictionary for the dataset (field definitions quoted). Retrieved 6 October 2026.
- Federal Emergency Management Agency. Disaster Declarations Summaries, v2. Used for disaster names, states, dates and incident types.
- FEMA National Flood Insurance Program. FloodSmart.gov. Quoted line retrieved 6 October 2026.
- National Association of Insurance Commissioners. State insurance department directory.
- FEMA OpenFEMA Terms and Conditions.
- No survey, interview or inspection was conducted for this report. Every figure is computed from the retrieved files.
This product uses the Federal Emergency Management Agency’s OpenFEMA API, but is not endorsed by FEMA. The Federal Government or FEMA cannot vouch for the data or analyses derived from these data after the data have been retrieved from the Agency’s website(s).