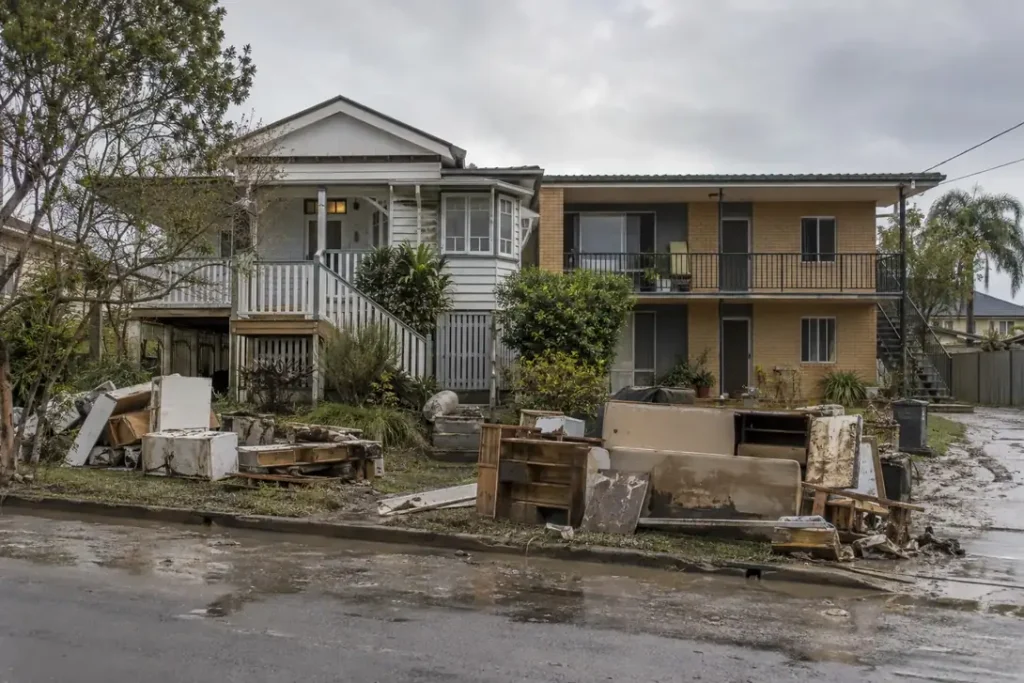
The finding
The owner renter damage gap is not mainly a gap in how badly each group is hit. It is a gap in what the assistance pays for. Across 15,121,818 owner registrations and 10,822,370 renter registrations in FEMA Individual Assistance records covering 2002 to 2026, approval rates sit close together at 46.8% and 45.9%, and mean grants differ by $650. The split that matters is that rental assistance accounts for 31.0% of renter assistance against 16.2% for owners. Same storm, two different kinds of loss.
Headline figures
In this report
- Why a damage-severity comparison is not possible
- What each file does record
- The comparable metrics side by side
- Where the assistance goes
- Grant band distribution
- Registrations per 100,000 residents by state
- Approval rate by state, both populations
- Method
- Reproduce this
- What this does not show
- Questions this report answers
- Sources
Key findings
- Approval rates are close: 46.8% of 15,121,818 owner registrations and 45.9% of 10,822,370 renter registrations were approved for assistance.
- Mean approved grant is $3,600 for owners and $2,950 for renters, a difference of $650.
- Rental assistance is 31.0% of renter assistance against 16.2% for owners, a 1.9 times difference. This is the clearest signal that the two groups experience the same event differently.
- Repair and replace assistance is 57.9% of owner assistance and 0.1% of renter assistance. A renter does not own the structure, so the programme does not pay a renter to repair it.
- Other needs assistance is 68.9% of renter assistance against 26.0% for owners, which is the mirror image of the repair split.
- Grant bands are comparable and they diverge: 74.3% of approved owner grants fall in the $1 to $10,000 band against 95.4% of renter grants.
- The statutory maximum is rare for both groups. 80,032 owner grants (1.13% of approvals) and 16,531 renter grants (0.33%) reached it.
- Registration intensity varies enormously. Puerto Rico records 56,986 owner and 28,955 renter registrations per 100,000 residents, against 30 and 81 in Utah.
Why a damage-severity comparison is not possible
Read this section before any figure below. The two FEMA housing assistance files do not record damage on the same scale, and the obvious comparison is therefore not available.
The owners file bands inspected damage in dollars: no damage, $1 to $10,000, $10,001 to $20,000, $20,001 to $30,000, and above $30,000. The renters file bands the same inspections by named severity instead: no damage found, moderate, major, and substantial. FEMA does not publish a dollar equivalent for moderate, major or substantial, and the severity names are assessment categories rather than cost brackets.
That means a sentence of the form “renter damage is more severe than owner damage” cannot be supported from these files, in either direction. Lining up 5.8% moderate against the owners’ 74.3% in a dollar band would be comparing a judgement to a price. We have seen that comparison made. It is not available in the data.
What is comparable is everything downstream of the assessment, because both files carry identical assistance fields: registrations, approvals, total approved assistance, the three assistance components, and the three grant bands. Those are the same scale for both populations and every comparison in this report uses them.
What each file does record
| Field group | Owners file | Renters file | Comparable? |
|---|---|---|---|
| Damage severity | Four dollar bands plus a no-damage count | Three named severity categories plus a no-damage count | No |
| Average damage | averageFemaInspectedDamage and totalDamage | Not present | No |
| Registrations | validRegistrations | validRegistrations | Yes |
| Approvals | approvedForFemaAssistance | approvedForFemaAssistance | Yes |
| Total assistance | totalApprovedIhpAmount | totalApprovedIhpAmount | Yes |
| Assistance components | repairReplaceAmount, rentalAmount, otherNeedsAmount | repairReplaceAmount, rentalAmount, otherNeedsAmount | Yes |
| Grant bands | Three bands plus totalMaxGrants | Three bands plus totalMaxGrants | Yes |
For completeness, the renter severity counts are 10,796,084 inspections in total: no damage found 93.3%, moderate damage 5.8%, major damage 0.7%, substantial damage 0.2%. Those shares are reported here as a record of the renters file, not as a counterpart to the owner dollar bands. Our restoration job size distribution reads the owner damage bands as a picture of where restoration work sits.
The comparable metrics side by side
| Metric | Owners | Renters | Difference |
|---|---|---|---|
| Valid registrations | 15,121,818 | 10,822,370 | 4,299,448 |
| Approved for assistance | 7,070,433 | 4,966,297 | 2,104,136 |
| Approval rate | 46.8% | 45.9% | +0.9 pts |
| Total approved assistance | $25,451,448,848 | $14,648,127,169 | $10,803,321,679 |
| Mean approved grant | $3,600 | $2,950 | $650 |
| Grants at statutory maximum | 80,032 | 16,531 | 63,501 |
The approval rates are the surprise. A difference of 0.9 percentage points across populations of 15,121,818 and 10,822,370 registrations is small. Whatever separates these two groups, it is not visible in whether an application succeeds.
The mean grant difference of $650 is larger in proportional terms, with the owner mean 1.22 times the renter mean. Even so, both means sit in the low thousands against restoration costs that run higher, which is the subject of our disaster grant ledger report.
Where the assistance goes
| Assistance component | Owner dollars | Owner share | Renter dollars | Renter share |
|---|---|---|---|---|
| Repair and replace | $13,985,589,157 | 57.9% | $13,034,614 | 0.1% |
| Rental assistance | $3,914,101,524 | 16.2% | $4,170,211,917 | 31.0% |
| Other needs | $6,273,384,269 | 26.0% | $9,289,336,807 | 68.9% |
This is the gap, and it is close to total. Repair and replace assistance is 57.9% of owner assistance dollars and 0.1% of renter dollars. Rental assistance runs the other way, 31.0% for renters against 16.2% for owners. Our SBA disaster loan report covers the other federal channel, setting verified losses against the loans approved.
The reading is straightforward. An owner-occupant who loses a kitchen needs the kitchen rebuilt, so the assistance pays toward repair. A renter in the same building does not own the kitchen, so the assistance pays toward somewhere else to live and toward replacing personal property. Other needs assistance, which covers personal property among other categories, is 68.9% of renter dollars against 26.0% of owner dollars.
For a restoration firm the practical consequence sits in who is paying. Where the damaged units are tenanted, the party commissioning the drying and repair work is the landlord or its insurer, not the occupant receiving the FEMA grant. The occupant’s assistance is largely going toward rehousing. That changes who the customer is on the same street after the same storm.
Grant band distribution
| Approved grant band | Owner grants | Owner share | Renter grants | Renter share |
|---|---|---|---|---|
| $1 to $10,000 | 5,252,193 | 74.28% | 4,739,784 | 95.44% |
| $10,001 to $25,000 | 1,080,951 | 15.29% | 201,057 | 4.05% |
| $25,001 to the maximum | 737,289 | 10.43% | 25,456 | 0.51% |
Here the two populations genuinely separate. 95.4% of renter grants fall in the $1 to $10,000 band against 74.3% of owner grants, and 10.4% of owner grants reach the $25,001 and above band against 0.51% of renter grants. Renter grants cluster tightly at the bottom of the scale.
The statutory maximum is rare for both. 80,032 owner grants and 16,531 renter grants reached it, which is 1.13% and 0.33% of approvals respectively.
Registrations per 100,000 residents by state
| State | Owner registrations | Owner per 100k | Renter registrations | Renter per 100k | Renter share of both |
|---|---|---|---|---|---|
| Puerto Rico | 1,825,437 | 56,986 | 927,520 | 28,955 | 33.7% |
| Louisiana | 1,818,534 | 39,553 | 1,611,007 | 35,039 | 47.0% |
| Florida | 3,997,056 | 17,102 | 3,132,438 | 13,402 | 43.9% |
| Mississippi | 483,277 | 16,421 | 283,441 | 9,631 | 37.0% |
| Texas | 2,246,010 | 7,178 | 1,911,928 | 6,110 | 46.0% |
| South Carolina | 407,090 | 7,430 | 232,956 | 4,252 | 36.4% |
| Alabama | 343,950 | 6,669 | 201,059 | 3,898 | 36.9% |
| Georgia | 518,909 | 4,641 | 274,160 | 2,452 | 34.6% |
| North Carolina | 392,412 | 3,553 | 250,509 | 2,268 | 39.0% |
| New Jersey | 309,875 | 3,262 | 178,314 | 1,877 | 36.5% |
| Michigan | 296,411 | 2,923 | 207,301 | 2,044 | 41.2% |
| Maine | 67,132 | 4,778 | 2,433 | 173 | 3.5% |
| West Virginia | 60,777 | 3,434 | 15,274 | 863 | 20.1% |
| Illinois | 336,878 | 2,650 | 186,896 | 1,470 | 35.7% |
| Tennessee | 126,102 | 1,745 | 138,012 | 1,909 | 52.3% |
Puerto Rico and Louisiana sit far above everywhere else on this measure, at 85,941 and 74,592 combined registrations per 100,000 residents. The renter share of registrations is also informative: it runs 33.7% in Puerto Rico and 47.0% in Louisiana, which tracks local tenure mix as much as it tracks hazard.
Because registrations here accumulate over more than two decades while the population denominator is a single 2025 estimate, these rates should be read as relative intensity across states, not as a per-year probability for any resident.
Approval rate by state, both populations
| State | Owner approval rate | Renter approval rate | Gap in points | Owner mean grant | Renter mean grant |
|---|---|---|---|---|---|
| Illinois | 76.3% | 60.6% | +15.7 | $3,821 | $3,826 |
| New Jersey | 44.9% | 31.1% | +13.7 | $5,288 | $5,103 |
| Iowa | 60.5% | 48.3% | +12.1 | $6,181 | $4,277 |
| Wisconsin | 78.4% | 66.6% | +11.8 | $4,574 | $3,096 |
| Michigan | 66.6% | 56.1% | +10.5 | $3,898 | $2,281 |
| New York | 54.6% | 45.8% | +8.9 | $6,966 | $5,361 |
| Kentucky | 58.3% | 52.0% | +6.2 | $7,242 | $5,251 |
| Texas | 45.5% | 41.5% | +4.0 | $3,514 | $1,998 |
| Ohio | 63.8% | 60.7% | +3.0 | $2,063 | $3,562 |
| Louisiana | 54.6% | 53.0% | +1.6 | $4,587 | $4,997 |
| Indiana | 58.4% | 57.3% | +1.2 | $4,056 | $3,764 |
| Florida | 37.7% | 36.8% | +1.0 | $2,760 | $1,753 |
| Pennsylvania | 60.0% | 59.2% | +0.9 | $3,474 | $4,087 |
| South Carolina | 49.1% | 49.2% | -0.2 | $1,926 | $1,700 |
| North Carolina | 45.4% | 46.2% | -0.8 | $4,181 | $2,607 |
State-level gaps run in both directions. Illinois shows the widest owner advantage at +15.7 points, while California runs the other way at -21.6 points. Across all 25 qualifying states the national gap of +0.9 points is a net figure that conceals state variation in both directions, and the mix of disasters in each state differs, so no single explanation follows from this table.
Method
How we counted. We retrieved 160,390 rows from FEMA OpenFEMA HousingAssistanceOwners v2 and 147,970 rows from HousingAssistanceRenters v2 on 3 October 2026. Each row is an aggregate for one declared disaster, state, county, city and postcode, so every figure is a sum of fields across rows rather than a count of rows. Approval rate is approvedForFemaAssistance divided by validRegistrations. Mean grant is totalApprovedIhpAmount divided by approvedForFemaAssistance, computed from the summed totals rather than by averaging per-row means. Component shares use the sum of repairReplaceAmount, rentalAmount and otherNeedsAmount as the base, not totalApprovedIhpAmount, because those three fields sum to 95.0% of the owner total and 92.0% of the renter total rather than to 100%. Grant band shares use the sum of the three band counts as the base. Per-capita rates use US Census Bureau Vintage 2025 state resident population estimates. No damage-severity comparison is attempted between the two files, for the reason set out above. State tables require at least 20,000 registrations in the relevant population, and territory codes are excluded from per-capita and state tables while remaining in national totals. No inflation adjustment is applied.
Reproduce this
Reproduce this
- Endpoint
https://www.fema.gov/api/open/v2/HousingAssistanceOwners and https://www.fema.gov/api/open/v2/HousingAssistanceRenters- Query
$top=5000 paged with $skip- Rows retrieved
- 160,390 owner rows and 147,970 renter rows
- Retrieved
- 3 October 2026
Both endpoints page at 5,000 rows via $top and $skip. No API key is required. The two files must be pulled separately because they carry different fields.
What this does not show
What this does not show
- No damage-severity comparison. The dollar bands in the owners file and the named severity categories in the renters file are not the same scale. Nothing in this report compares them, and no published crosswalk between them exists.
- FEMA assistance is not a restoration cost. Approved assistance reflects capped, need-based eligibility, not what repair work costs.
- Renter records describe the dwelling, not the tenancy. The severity assessment is made on the unit. It carries no information about lease terms, rent level, length of occupancy or whether the tenant returned.
- Owner and renter registrations are counted separately. A single address can generate records in both files, and a household containing both an owner-occupant and a tenant is two registrations, not one. The two totals must not be added together as a count of affected households.
- Declared disasters only, registrants only. Undeclared events and households that never registered with FEMA are absent from both files, which together is the large majority of water and fire losses.
- Tenure is self-reported at registration. Which file a record lands in follows from the applicant’s stated occupancy status.
- Component fields do not sum to the total. The three assistance components cover 95.0% of owner assistance and 92.0% of renter assistance. The remainder is not attributable from the published fields, so component shares are of the component total.
- No inflation adjustment. Dollar figures span 2002 to 2026 in nominal terms, and the statutory assistance maximum has changed over that period.
Most quotable figures
- Rental assistance is 31.0% of renter assistance dollars against 16.2% for owners, a 1.9 times difference (FEMA OpenFEMA Housing Assistance v2, 2002 to 2026).
- Approval rates are nearly level: 46.8% of 15,121,818 owner registrations and 45.9% of 10,822,370 renter registrations (FEMA OpenFEMA, retrieved 3 October 2026).
- Mean approved grant is $3,600 for owners and $2,950 for renters, a gap of $650 (FEMA OpenFEMA, retrieved 3 October 2026).
- The owner and renter files use different damage schemas, dollar bands against named severity categories, so no direct severity comparison between the two populations is available from FEMA Housing Assistance data.
Questions this report answers
Do renters get less FEMA assistance than owners?
On the comparable measures, renters receive a smaller mean grant: $2,950 against $3,600 for owners across 2002 to 2026. Approval rates are close at 45.9% and 46.8%. The larger difference is in what the money is for.
Why can’t owner and renter damage severity be compared?
The two FEMA files use different schemas. The owners file bands inspected damage in dollars, and the renters file uses the named categories moderate, major and substantial. FEMA publishes no dollar equivalent for those categories, so the two scales cannot be aligned.
What does rental assistance pay for?
It covers temporary housing. It is 31.0% of renter assistance dollars and 16.2% of owner dollars, which is the sharpest split between the two populations in these files.
Why is repair and replace assistance almost absent for renters?
A renter does not own the structure, so repairing it is not the renter’s expense. Repair and replace assistance is 0.1% of renter dollars against 57.9% of owner dollars.
Which states see the most registrations per head?
On combined owner and renter registrations per 100,000 residents using Census Vintage 2025 population, Puerto Rico leads at 85,941, followed by Louisiana at 74,592 and Florida at 30,504.
Can the owner and renter totals be added together?
No. The two files count registrations separately, and one address can appear in both. Adding the totals would overstate the number of affected households.
Can I reuse these figures?
Yes. The tables and derived figures are released under CC BY 4.0 with attribution to Remediation Insider. The underlying FEMA data is public and reproducible from the endpoints listed above.
How to cite
Remediation Insider. The Owner and Renter Damage Gap: Two Different Disasters. https://remediationinsider.com/owner-renter-damage-gap/ (retrieved 2 October 2026).
Data and tables in this report are released under CC BY 4.0. Attribution: Remediation Insider.
Sources
- Federal Emergency Management Agency. FEMA OpenFEMA Housing Assistance, v2. HousingAssistanceOwners, 160,390 aggregated rows, retrieved 3 October 2026.
- Federal Emergency Management Agency. HousingAssistanceRenters v2, 147,970 aggregated rows, retrieved 3 October 2026.
- FEMA OpenFEMA Terms and Conditions.
- US Census Bureau, Vintage 2025 state resident population estimates, used only as the denominator for per-capita rates.
- Field definitions and severity category names are taken from the FEMA OpenFEMA data dictionary for both datasets.
- No survey, interview or physical inspection was conducted for this report. Every figure is computed at build time from the retrieved FEMA files.
This product uses the Federal Emergency Management Agency’s OpenFEMA API, but is not endorsed by FEMA. The Federal Government or FEMA cannot vouch for the data or analyses derived from these data after the data have been retrieved from the Agency’s website(s).