The finding
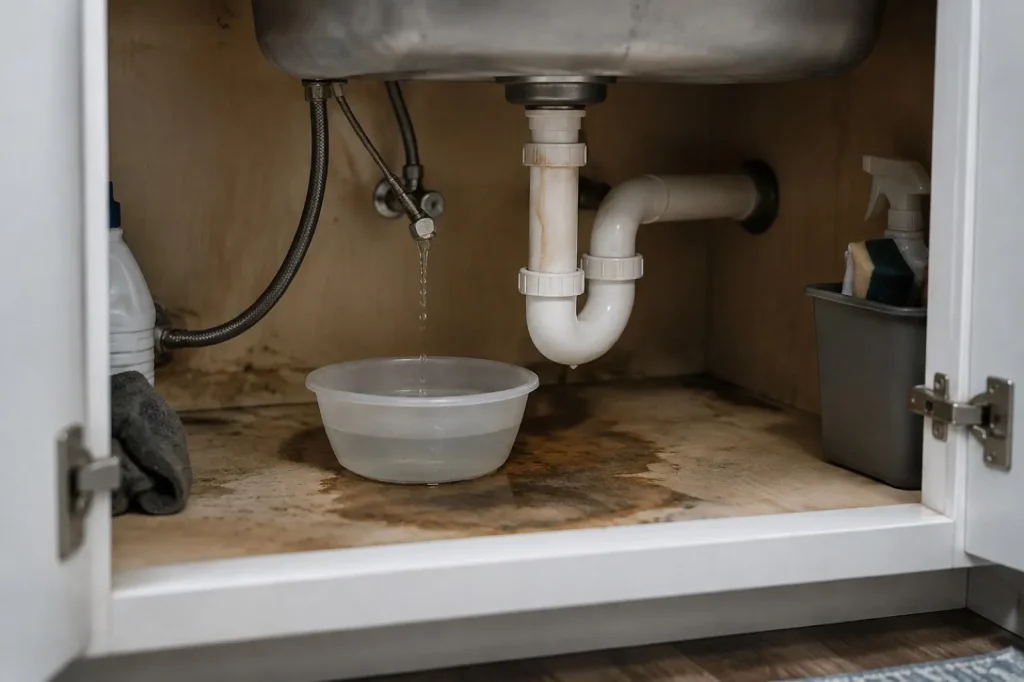
How common are water leaks in homes? In the 2023 American Housing Survey, 15.4% of occupied US homes, an estimated 20.5 million, reported water leaking in from outside or from inside in the previous 12 months: about 3 in 20. Outside leaks (8.8%) and inside leaks (8.4%) are nearly equal in size. The roof is the most reported outside source and leaking pipes the most reported inside source.
Headline figures
In this report
Key findings
- 15.4% of occupied US homes (90% margin plus or minus 0.3 points), an estimated 20.5 million, had a water leak from outside or inside in the 12 months before their 2023 interview (Census AHS 2023).
- Pipes are the most reported inside source: 44% of homes with an inside leak, or 3.7% of all homes, about 4.9 million (Census AHS 2023).
- The roof is the most reported outside source: 50% of homes with an outside leak, about 5.8 million homes (Census AHS 2023).
- Renters report more inside leaks than owners (10.5% vs 7.3%); owners report more outside leaks (9.2% vs 7.9%). Both gaps clear the 90% margin (Census AHS 2023).
- Homes built in 1939 or earlier reported leaks at 22.5%, 2.8 times the 8.2% of homes built in 2010 or later, mostly because of outside leaks (Census AHS 2023).
- Leaks are not concentrated in low-income homes: any-leak rates run from 14.4% to 16.1% across five income bands, with 15.1% under $30,000 and 16.1% at $150,000 or more (Census AHS 2023).
- 10.6% of leak homes also reported mold, against 1.6% of homes without a leak (Census AHS 2023).
This report uses the US Census Bureau’s American Housing Survey, the national housing survey sponsored by the Department of Housing and Urban Development, which interviewed 48,527 occupied homes for its 2023 national sample. It counts the ordinary water events inside homes, the burst supply line, the overflowing toilet, the roof that lets go in a storm, rather than declared disasters. That makes it a different lens from the flood claim data in the insured flood loss gap report: smaller events, far more homes, and no insurance filter.
The scale: leak homes per 100
The American Housing Survey asks two separate questions: did water leak into the home from outside (through the roof, outside walls, basement or closed windows), and did water leak from inside (broken pipes or water heaters, backed up plumbing, a neighbouring unit). Counting a home once whichever way the water came in, 15 of every 100 occupied homes had at least one leak in the 12 months before interview (Census AHS 2023). Outside leaks are slightly more common than inside leaks (8.8% against 8.4%), a gap of 0.4 points that clears the 90% margin of error (Census AHS 2023).
| Measure | Share of occupied homes | 90% margin (pts) | Estimated homes |
|---|---|---|---|
| Outside leak, past 12 months | 8.8% | 0.3 | 11.8 million |
| Inside leak, past 12 months | 8.4% | 0.3 | 11.2 million |
| Either (any leak) | 15.4% | 0.3 | 20.5 million |
| Both inside and outside | 1.8% | 0.1 | 2.4 million |
| Outside only | 7.0% | 0.2 | 9.3 million |
| Inside only | 6.6% | 0.2 | 8.8 million |
Both kinds of leak in the same year is less common: 1.8% of all homes, which is 12% of the homes that had any leak (Census AHS 2023). Read the other way, most leak homes deal with one failure path, either the envelope or the plumbing, not both.
What fails: the sources, ranked
Ranked across all occupied homes, a leaking roof and leaking pipes are the two most common sources: 4.4% of homes reported roof water and 3.7% reported a pipe leak, roughly 5.8 million and 4.9 million homes (Census AHS 2023). The chart puts every source on one scale, homes per 10,000.
Inside leaks: pipes first, water heaters last
Among homes with an inside leak, 44% named leaking pipes (the question counts pipe leaks coming from other apartments), 24% named their own plumbing fixtures backing up or overflowing, and 9% a broken water heater (Census AHS 2023). Water heaters are the least common named source but still an estimated 1.0 million homes in a year.
| Reported source | Share of inside homes | 90% margin (pts) | Share of all occupied homes | Estimated homes | Unweighted n (leak homes answering) |
|---|---|---|---|---|---|
| Pipes leaked | 43.8% | 1.5 | 3.65% | 4.9 million | 4,161 |
| Other inside source | 25.5% | 1.5 | 2.13% | 2.8 million | 4,161 |
| Own plumbing fixtures backed up or overflowed | 23.9% | 1.4 | 2.00% | 2.7 million | 4,161 |
| Broken water heater | 9.4% | 0.9 | 0.79% | 1.0 million | 4,161 |
| Inside source unknown | 3.8% | 0.6 | 0.32% | 0.4 million | 4,161 |
Outside leaks: half are the roof
Among homes with an outside leak, 50% reported water through the roof, 24% through the basement and 21% through walls or around closed windows or doors (Census AHS 2023). Basement leaks are bounded by which homes have basements, which varies sharply by region; see the division table below.
| Reported source | Share of outside homes | 90% margin (pts) | Share of all occupied homes | Estimated homes | Unweighted n (leak homes answering) |
|---|---|---|---|---|---|
| Roof | 50.2% | 1.8 | 4.38% | 5.8 million | 4,042 |
| Basement | 24.0% | 1.6 | 2.10% | 2.8 million | 4,042 |
| Walls or around closed windows or doors | 21.1% | 1.3 | 1.85% | 2.5 million | 4,042 |
| Somewhere else (outside) | 12.8% | 1.1 | 1.11% | 1.5 million | 4,042 |
Owners vs renters: the leak flips direction
Renters report a leak of any kind a little more often than owners (16.3% against 14.9%, a gap that clears the 90% margin of error), but the bigger difference is where the water comes from. Renters are more likely to report an inside leak (10.5% against 7.3%), a gap that clears the 90% margin of error. Owners are more likely to report an outside leak (9.2% against 7.9%), a gap that clears the 90% margin of error (Census AHS 2023).
The inside question counts pipe leaks from other apartments, and renters more often live in buildings with neighbours above and beside them. Within inside leaks, pipes were named by 44% of renters and 44% of owners (Census AHS 2023), so the renter gap is about how often inside leaks happen, not a different mix of sources. Roofs and basements, by contrast, belong mostly to the detached houses most owners live in. For how this split shows up in disaster damage, see the owner and renter damage gap report.
| Tenure | Any leak | 90% margin (pts) | Inside leak | Outside leak | Pipe leak | Unweighted n |
|---|---|---|---|---|---|---|
| Owner | 14.9% | 0.4 | 7.3% | 9.2% | 3.2% | 28,192 |
| Renter | 16.3% | 0.6 | 10.5% | 7.9% | 4.6% | 19,735 |
| Occupied without rent | 17.0% | 2.6 | 10.2% | 10.8% | 3.3% | 600 |
Housing age: older stock leaks more, mostly from outside
Leak rates fall with every newer construction era in the table. 22.5% of homes built in 1939 or earlier reported a leak, against 8.2% of homes built in 2010 or later, 2.8 times higher and a gap that clears the 90% margin of error (Census AHS 2023). Most of the gap is outside water: 14.9% against 4.2% for outside leaks, compared with 10.3% against 4.7% for inside leaks (Census AHS 2023).
| Year built | Any leak | 90% margin (pts) | Inside leak | Outside leak | Roof leak | Unweighted n |
|---|---|---|---|---|---|---|
| 1939 or earlier | 22.5% | 1.1 | 10.3% | 14.9% | 6.1% | 5,690 |
| 1940 to 1959 | 17.9% | 0.9 | 8.5% | 11.7% | 5.8% | 6,739 |
| 1960 to 1979 | 16.5% | 0.7 | 9.1% | 9.3% | 4.6% | 12,352 |
| 1980 to 1999 | 14.7% | 0.6 | 9.1% | 7.4% | 4.0% | 12,572 |
| 2000 to 2009 | 12.1% | 0.8 | 7.3% | 6.2% | 3.4% | 6,511 |
| 2010 or later | 8.2% | 0.8 | 4.7% | 4.2% | 2.4% | 4,663 |
Treat this as description, not cause. Building age travels with other things that also bear on leaks: region and climate, whether there is a basement, building type, and how long the household has lived there. Residents of the newest homes have often lived there for less than a year, and the leak question covers only the time since they moved in, which shortens their window. The table cannot separate these effects.
Building type: apartments leak from inside, houses from outside
In buildings with five or more apartments, 11.3% of homes reported an inside leak against 7.2% of detached one-family houses, a gap that clears the 90% margin of error. For outside leaks the order reverses: 9.2% of detached houses against 6.8% of homes in larger apartment buildings, a gap that clears the 90% margin of error (Census AHS 2023). The highest inside leak rate in the Census table is in 20 to 49 apartments (12.0%), and the highest any-leak rates are in the manufactured or mobile home category (18.7%) and the 2 to 4 apartments category (18.6%). For a contractor, that is the difference between a stack of units sharing pipes and a single roof over a single family. The flood loss by building type report makes the same cut for flood claims.
| Units in structure | Any leak | 90% margin (pts) | Inside leak | Outside leak | Pipe leak | Unweighted n |
|---|---|---|---|---|---|---|
| Manufactured or mobile home | 18.7% | 1.7 | 10.7% | 11.2% | 5.6% | 1,987 |
| One-family house, detached | 14.7% | 0.4 | 7.2% | 9.2% | 3.1% | 27,640 |
| One-family house, attached | 14.2% | 1.1 | 8.6% | 7.3% | 4.5% | 3,461 |
| 2 to 4 apartments | 18.6% | 1.4 | 10.8% | 10.0% | 4.4% | 3,866 |
| 5 to 19 apartments | 16.7% | 1.1 | 11.7% | 7.2% | 4.6% | 5,028 |
| 20 to 49 apartments | 17.0% | 1.6 | 12.0% | 7.3% | 4.0% | 2,303 |
| 50 or more apartments | 14.8% | 1.2 | 10.3% | 5.9% | 4.9% | 4,217 |
| Boat, RV, van or similar | suppressed | n/a | suppressed | suppressed | suppressed | 25 |
Where: the nine census divisions
The AHS national file identifies nine census divisions, not states, so this is the finest geography it supports. Any-leak rates run from 13.2% in South Atlantic to 18.3% in West North Central (Census AHS 2023). The basement column carries most of the regional story: 5.1% of homes in West North Central reported basement water, against 0.1% in West South Central, a gap that reflects where basements are built as much as how wet the ground is. Pipe leaks are flatter, from 3.0% in West North Central to 4.3% in East South Central (Census AHS 2023).
| Census division | Any leak | 90% margin (pts) | Pipe leak | Roof leak | Basement leak | Unweighted n |
|---|---|---|---|---|---|---|
| West North Central | 18.3% | 2.0 | 3.0% | 4.0% | 5.1% | 1,904 |
| Middle Atlantic | 18.0% | 1.1 | 4.2% | 4.6% | 3.7% | 5,427 |
| New England | 17.8% | 1.3 | 3.9% | 3.7% | 4.8% | 3,082 |
| East North Central | 16.5% | 1.1 | 3.2% | 4.0% | 4.8% | 7,063 |
| Mountain | 15.9% | 1.5 | 3.5% | 4.3% | 1.1% | 3,236 |
| East South Central | 14.7% | 1.4 | 4.3% | 5.2% | 1.1% | 1,988 |
| West South Central | 14.2% | 0.9 | 3.8% | 4.7% | 0.1% | 6,232 |
| Pacific | 14.1% | 0.7 | 3.6% | 4.8% | 0.4% | 9,827 |
| South Atlantic | 13.2% | 0.7 | 3.6% | 4.1% | 0.6% | 9,768 |
Divisions with overlapping margins should not be ranked against each other. The AHS cannot give state figures; for the timing of restoration demand across the year, see the restoration seasonality calendar.
Income: leaks are not a low-income problem
Across five household income bands, any-leak rates sit between 14.4% ($60,000 to $99,999) and 16.1% ($150,000 or more), a gap that clears the 90% margin of error (Census AHS 2023). The rate does not rise or fall steadily with income: households under $30,000 reported 15.1% and households on $150,000 or more 16.1%, a gap within the 90% margin of error. A water leak in the past year is not concentrated in low-income homes. Income overlaps with tenure, building type and housing age, which push in different directions in the tables above; this report does not separate them.
| Household income (HINCP) | Any leak | 90% margin (pts) | Inside leak | Outside leak | Unweighted n |
|---|---|---|---|---|---|
| Under $30,000 | 15.1% | 0.7 | 8.6% | 8.6% | 13,007 |
| $30,000 to $59,999 | 15.6% | 0.8 | 8.4% | 9.1% | 9,549 |
| $60,000 to $99,999 | 14.4% | 0.7 | 7.9% | 8.2% | 9,397 |
| $100,000 to $149,999 | 16.0% | 1.0 | 8.4% | 9.0% | 6,925 |
| $150,000 or more | 16.1% | 0.8 | 8.8% | 9.3% | 9,649 |
Leaks and mold, in one paragraph
Among homes with any leak in the past 12 months, 10.6% also reported mold covering at least a sheet of paper’s area, against 1.6% of homes with no leak, 6.7 times higher and a gap that clears the 90% margin of error. Where both inside and outside leaks occurred, the mold share was 20.4%, and 55% of homes with mold reported a leak (Census AHS 2023). The survey records both in the same 12 months but not which came first. The full mold analysis, by room and housing type, is in the homes with mold report.
Method
How we counted. We read the 2023 AHS national public use file v1.1 (household.csv, 55,669 records) and kept the 48,527 occupied housing units (TENURE 1, 2 or 3); 7,142 vacant or non-interview records carry no leak answers and were dropped. No occupied record lacked an answer to LEAKO or LEAKI, so none was excluded for non-response. Every estimate uses the final weight WEIGHT; the occupied base sums to 133.2 million homes. Source shares among leak homes exclude homes that did not report the source item (35 inside-leak and 46 outside-leak homes coded -9); source shares of all homes exclude the same records from the denominator. The mold cross-tab drops 364 homes with no reported answer to the mold items; ‘mold’ means mold reported in any room. The PUF carries 160 replicate weights (REPWEIGHT1 to REPWEIGHT160). Standard errors follow the Census Bureau formula, variance = 4/160 times the sum of squared differences between each replicate estimate and the full-sample estimate, and margins are 90% (1.645 standard errors), the AHS convention. Differences between groups are tested on the replicate distribution of the difference itself. Any cell resting on fewer than 100 unweighted cases is suppressed (Boat, RV, van or similar). Variable meanings are taken from the 2023 AHS Definitions and Items Booklet and code labels from the AHS 2023 Value Labels Package. The AHS home improvement project file was not used: its questionnaire tells respondents not to report routine work such as fixing a broken water pipe, so it cannot measure leak repair spending.
Reproduce this
Reproduce this
- Endpoint
https://www2.census.gov/programs-surveys/ahs/2023/AHS%202023%20National%20PUF%20v1.1%20CSV.zip- Query
household.csv: keep TENURE in ('1','2','3'); flags LEAKO, LEAKI ('1' yes, '2' no); sources LEAKIPIPE, LEAKIPLUM, LEAKIWATH, LEAKIOTH, LEAKIDK, LEAKOROOF, LEAKOBASE, LEAKOWALL, LEAKOOTH ('-9' not reported, '-6' not applicable); weight WEIGHT; SE from REPWEIGHT1 to REPWEIGHT160, var = 4/160 * sum((est_r - est_0)^2)- Rows retrieved
- 55,669 household records, 48,527 occupied
- Retrieved
- 6 October 2026
Values in the CSV are wrapped in single quotes; strip them before comparing codes. The 2023 file has no state identifier; DIVISION is the finest geography. Group cuts use YRBUILT, BLD, DIVISION and HINCP as coded in the PUF.
What this does not show
What this does not show
- Self-reported, by one household member. Leaks the respondent did not notice or remember are missed; nothing was inspected.
- A 12-month window. The question covers the 12 months before interview, or the time since moving in if shorter. It is not a lifetime or per-year probability for a given house.
- Homes, not events. A home with three pipe leaks counts once. The survey gives no count of incidents.
- Sources are multi-select. A home can name several sources, so source shares sum above 100% (inside sources sum to 106%).
- No severity, cost or insurance measure. A drip under a sink and a ceiling collapse count the same. Nothing here says how many leaks needed professional drying or restoration.
- National and division level only. The 2023 AHS national file has no state identifier. No state figures are given.
- Associations, not causes. Age, tenure, building type, region and income overlap; the tables do not separate them.
- Sampling error only. Margins come from the replicate weights and do not capture recall or reporting error.
Most quotable figures
- About 3 in 20 occupied US homes (15.4%, roughly 20.5 million) reported a water leak in the 12 months before their 2023 American Housing Survey interview (Census AHS 2023).
- Leaking pipes were named in 44% of US homes with an inside water leak, about 4.9 million homes in a year (Census AHS 2023).
- Half of outside water leaks in US homes come through the roof: 50.2% of homes with an outside leak (Census AHS 2023).
- US renters report inside water leaks at 10.5%, owners at 7.3%; for outside leaks it reverses, 9.2% for owners and 7.9% for renters (Census AHS 2023).
- Homes built before 1940 reported water leaks at 22.5%, against 8.2% for homes built since 2010 (Census AHS 2023).
- A broken water heater caused an inside leak in an estimated 1.0 million US homes in a year (Census AHS 2023).
Questions this report answers
How common are water leaks in homes?
In the 2023 American Housing Survey, 15.4% of occupied US homes reported a water leak from outside or inside in the past 12 months, about 3 in 20, or an estimated 20.5 million homes.
What is the most common cause of a water leak inside a home?
Leaking pipes. 44% of homes with an inside leak named pipes, including pipe leaks from neighbouring apartments, against 24% for their own plumbing fixtures backing up or overflowing and 9% for a broken water heater (Census AHS 2023).
Are outside leaks or inside leaks more common?
Outside leaks are slightly more common than inside leaks (8.8% against 8.4%), a gap of 0.4 points that clears the 90% margin of error. 1.8% of homes reported both in the same 12 months (Census AHS 2023).
Do older homes have more water leaks?
In the Census AHS, yes: 22.5% of homes built in 1939 or earlier against 8.2% of homes built in 2010 or later. Age overlaps with region, building type and length of residence, so the gap is not all down to age.
Do renters get more leaks than homeowners?
Renters report more inside leaks (10.5% against 7.3%) and owners more outside leaks (9.2% against 7.9%). Any-leak rates are 16.3% for renters and 14.9% for owners (Census AHS 2023).
Does this tell me what a leak costs to repair?
No. The AHS asks whether water leaked and from where, not how much damage it did or what repair cost. For decisions about a specific loss, use your insurer or a qualified local professional; for flood coverage questions, FloodSmart.gov.
How to cite
Remediation Insider. How Common Are Water Leaks in Homes? About 3 in 20 Homes a Year. https://remediationinsider.com/household-water-leak-report/ (retrieved 6 October 2026).
Data and tables in this report are released under CC BY 4.0. Attribution: Remediation Insider.
Sources
- US Census Bureau and US Department of Housing and Urban Development. American Housing Survey 2023, National Public Use File v1.1 (CSV). 55,669 household records. Retrieved 6 October 2026.
- US Census Bureau. 2023 AHS Definitions: ‘Water leakage during last 12 months’, ‘Units in structure’, ‘Year structure built’, ‘Census regions and divisions’.
- US Census Bureau. 2023 AHS Items Booklet: items LEAK1, LEAK2, WHERELK, ILEAK1, ILEAK2, WHERELK2, HINTRO2.
- US Census Bureau. AHS 2023 Value Labels Package: code labels for TENURE, BLD, YRBUILT, DIVISION and LEAK items.
- US Census Bureau. 2023 AHS National Sample Design, Weighting, and Error Estimation, and Quick Guide to Estimating Variance Using Replicate Weights: 2009 to Current.
- American Housing Survey program page, US Census Bureau.
- No survey, interview or physical inspection was conducted for this report. Every figure is computed at build time from the public Census file.