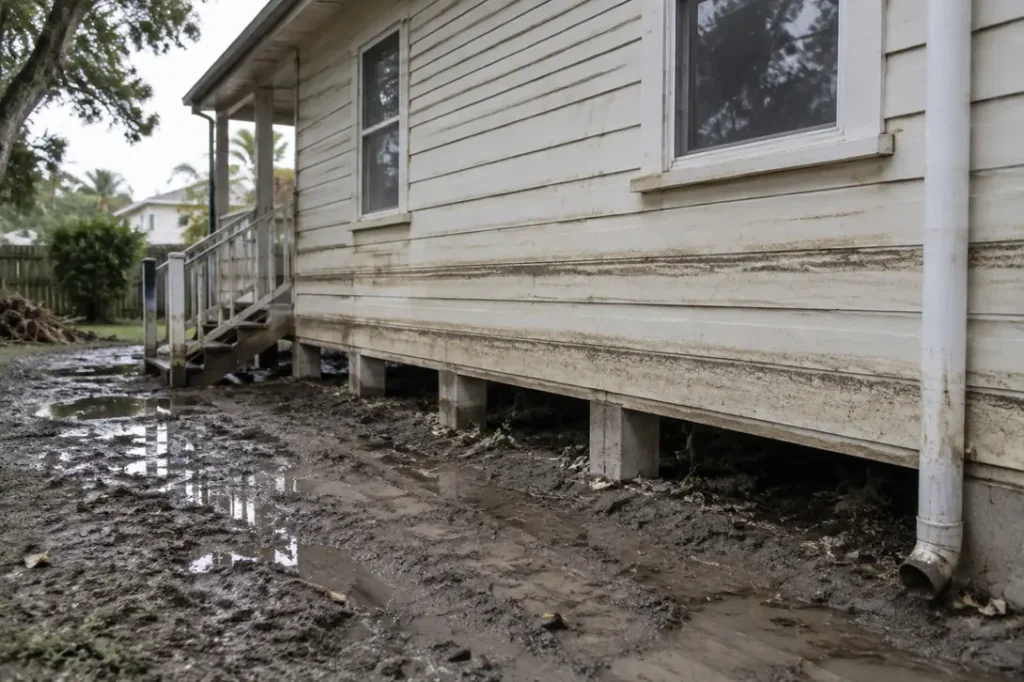
The finding
FEMA’s register of repetitive loss properties lists 240,651 buildings as of 2 August 2026, every one with a history of paid National Flood Insurance Program claims. In the FEMA file the typical building has 2 paid flood losses on record, 3,049 have 10 or more, and one has 63. Per FEMA, 56.4% are not insured by the NFIP today, 21.3% of those with a zone sit outside the mapped Special Flood Hazard Area, and 5.5% are recorded as mitigated.
Headline figures
In this report
- What puts a building on the list
- How many times they have flooded
- Outside the mapped flood zone
- Most are not insured by the NFIP today
- The mitigation gap
- Repetitive loss properties by state
- Counties and ZIP codes
- What the buildings are, and when they were built
- Method
- Reproduce this
- What this does not show
- Questions this report answers
- Sources
Key findings
- FEMA counts 240,651 repetitive loss properties carrying 740,000 paid NFIP losses between them, a mean of 3.07 and a median of 2.
- 34,996 (14.5%) are flagged NFIP severe repetitive loss, and 98.5% of those, 34,456 buildings, are not recorded as mitigated (FEMA).
- 135,647 properties, 56.4% of the list, are not insured by the NFIP as of the FEMA file date.
- 50,084 properties (21.3% of those with a recorded zone) are mapped in zones B, C or X, outside the Special Flood Hazard Area (FEMA).
- Mitigation rises with loss count but stays low: 1.8% of two-loss properties are mitigated against 23.3% of those with 10 to 19 losses (FEMA).
- Five states, Texas, Louisiana, Florida, New York and New Jersey, hold 61.1% of the list (FEMA).
- Louisiana has 839 repetitive loss properties per 100,000 residents, the highest rate of any state with at least 1,000 properties (FEMA, Census).
- 62.5% of buildings with a usable construction date were built before 1975, and 78.7% are flagged pre-FIRM (FEMA).
What puts a building on the list
FEMA’s NFIP Multiple Loss Properties dataset tracks structures with more than one NFIP claim across the history of the programme. A building is on it if it meets at least one of four definitions, quoted or closely paraphrased below from the FEMA OpenFEMA NFIP Multiple Loss Properties, v1 page.
| Category | FEMA definition | Properties flagged | Share of list |
|---|---|---|---|
| NFIP repetitive loss (nfipRl) | An NFIP-insured structure with two or more claims or losses resulting in claim payments totaling more than $1,000 per claim that are recorded in any 10-year period. | 219,028 | 91.0% |
| NFIP severe repetitive loss (nfipSrl) | An NFIP-insured structure with four or more separate claim payments, each (building and contents) exceeding $5,000 and together exceeding $20,000; or at least two separate building payments whose cumulative amount exceeds the market value of the building. | 34,996 | 14.5% |
| FMA repetitive loss (fmaRl) | An NFIP-insured structure that has incurred flood-related damage on two occasions, in which the cost of repair, on average, equaled or exceeded 25 percent of the value of the structure at the time of each flood event. | 40,493 | 16.8% |
| FMA severe repetitive loss (fmaSrl) | Defined on the dataset page with the same payment thresholds as NFIP severe repetitive loss, for use in the Flood Mitigation Assistance (FMA) grant program. | 50,131 | 20.8% |
Two details in the file are worth knowing before quoting it. 21,623 records are not flagged NFIP repetitive loss and are on the list through an FMA or severe repetitive loss flag alone. And 676 records show only one counted loss. FEMA’s totalLosses field counts paid claims above $1,000 since 1978, so a flag can rest on payments the count does not show; the FEMA dataset page does not reconcile the two, and we keep these records rather than drop them.
The FMA flags matter because the FEMA Flood Mitigation Assistance grant program uses them. FEMA’s dataset page gives the same payment thresholds for FMA severe repetitive loss as for the NFIP version, yet the file flags 50,131 properties under one and 34,996 under the other. The page does not explain the difference, so we report both counts without reconciling them.
How many times they have flooded
| Paid losses | Properties | Share of list | Severe repetitive loss | Mitigated | NFIP insured now |
|---|---|---|---|---|---|
| 1 counted loss | 676 | 0.3% | 31.4% | 0.7% | 26.0% |
| 2 losses | 123,737 | 51.4% | 2.8% | 1.8% | 43.1% |
| 3 losses | 57,305 | 23.8% | 3.6% | 4.0% | 48.3% |
| 4 to 5 | 40,726 | 16.9% | 42.9% | 12.0% | 41.2% |
| 6 to 9 | 15,158 | 6.3% | 63.5% | 20.5% | 38.7% |
| 10 to 19 | 2,829 | 1.2% | 69.7% | 23.3% | 38.0% |
| 20 or more | 220 | 0.1% | 79.5% | 18.2% | 45.0% |
The largest group is two-loss properties: 51.4% have exactly two paid losses (FEMA). The tail is long. 3,049 buildings have 10 or more paid NFIP losses, the median severe repetitive loss property has 5 losses, and the highest count on any record is 63 (FEMA). The severe flag climbs from 2.8% of two-loss records to 79.5% of records with 20 or more in the FEMA file, as the four-payment threshold in the definition implies.
For a restoration firm the count records how often one building has produced a paid flood claim, the closest public proxy for repeat water damage work at one site. It is not a forecast. Claims data by state and year is in our flood claims by state report.
Outside the mapped flood zone
| Zone group | Properties | Share of list | Severe repetitive loss | Mitigated | NFIP insured now |
|---|---|---|---|---|---|
| A zones (inside the SFHA) | 174,604 | 72.6% | 15.6% | 6.2% | 48.8% |
| V zones (inside the SFHA, coastal) | 10,165 | 4.2% | 17.3% | 7.3% | 50.5% |
| B, C and X zones (outside the SFHA) | 50,084 | 20.8% | 11.6% | 3.0% | 29.4% |
| D zone (undetermined) | 189 | 0.1% | 7.9% | 4.2% | 2.1% |
| No zone recorded | 5,609 | 2.3% | 3.3% | 1.8% | 0.0% |
In the FEMA file, 50,084 repetitive loss properties are recorded in zones B, C or X, the moderate and minimal risk zones outside the SFHA. That is 21.3% of records with a zone, and 5,796 of them carry the severe flag (FEMA). Only 29.4% of them are NFIP insured now, against 48.8% inside the SFHA (FEMA).
The zone is the one on the record, which may reflect the map in force when the property was last rated rather than the current map. Zone-level exposure across all policies is covered in our flood zone exposure report.
Most are not insured by the NFIP today
105,004 properties, 43.6%, are flagged as currently insured by the NFIP, so 135,647 are not (FEMA). Every property on the list was NFIP insured when its claims were paid; the flag describes status on the file date only. Primary residences are more often still insured, 51.9% against 30.9% for other properties. Of mitigated properties, 33.3% are insured (FEMA).
The data cannot say why a policy lapsed. A building may have been sold, demolished, bought out, insured privately or simply left uninsured, and the NFIP flag sees none of those. Private flood cover is invisible here. The gap between insured and uninsured flood loss is the subject of our insured flood loss gap report, and county policy counts are in the flood insurance take-up map.
One pattern in the file is worth flagging for anyone reusing it. Of 121,184 records with a one-digit occupancy code, 0.0% are flagged as currently insured, against 87.9% of 119,455 records with a two-digit code (FEMA). That is consistent with the occupancy code coming from each property’s most recent policy. The FEMA dataset page does not state this, so treat it as an observation about the file rather than a rule.
The mitigation gap
13,182 properties, 5.5% of the list, are recorded as mitigated (FEMA). Among the 34,996 severe repetitive loss properties, 34,456 are not, 98.5%, and 21,245 of those are also not NFIP insured now (FEMA). Of the 3,049 buildings with 10 or more paid losses, 2,350 are not recorded as mitigated in FEMA records.
The mitigated share rises with loss count, from 1.8% at two losses to 23.3% at 10 to 19, and is 18.2% for the 220 buildings with 20 or more (FEMA). The flag depends on FEMA’s own records being updated, so a local project FEMA has not logged would not show. Funded buyouts and elevations by state are in our FEMA buyouts by state report. Owners weighing mitigation should start with FEMA, their state floodplain management office or FloodSmart.gov.
Repetitive loss properties by state
| State | Properties | Per 100,000 residents | Severe share | Mitigated | NFIP insured now | Median losses |
|---|---|---|---|---|---|---|
| Texas | 39,248 | 125.4 | 17.7% | 5.2% | 43.3% | 2 |
| Louisiana | 38,553 | 838.5 | 14.1% | 10.9% | 46.8% | 3 |
| Florida | 33,589 | 143.7 | 16.0% | 3.7% | 58.0% | 2 |
| New York | 19,529 | 98.3 | 10.5% | 1.7% | 49.5% | 2 |
| New Jersey | 16,212 | 170.6 | 19.1% | 7.0% | 43.2% | 3 |
| North Carolina | 12,270 | 111.1 | 12.8% | 3.2% | 54.1% | 3 |
| Pennsylvania | 9,023 | 69.0 | 14.3% | 5.4% | 29.3% | 3 |
| Virginia | 6,618 | 75.1 | 10.1% | 3.2% | 54.9% | 2 |
| Mississippi | 6,046 | 205.4 | 13.0% | 10.2% | 29.4% | 2 |
| Alabama | 5,155 | 99.9 | 13.9% | 6.6% | 39.0% | 3 |
| Illinois | 4,527 | 35.6 | 11.2% | 6.2% | 27.7% | 2 |
| Missouri | 4,485 | 71.8 | 21.7% | 8.4% | 21.2% | 3 |
| South Carolina | 3,927 | 71.7 | 12.9% | 2.6% | 58.0% | 2 |
| California | 3,602 | 9.1 | 14.9% | 2.0% | 30.6% | 2 |
| Massachusetts | 3,460 | 48.5 | 13.9% | 1.5% | 42.3% | 3 |
| Measure | State or territory | Value |
|---|---|---|
| Highest per 100,000 residents | Louisiana | 838.5 |
| Lowest per 100,000 residents | California | 9.1 |
| Highest severe repetitive loss share | Missouri | 21.7% |
| Lowest severe repetitive loss share | Michigan | 7.9% |
| Highest mitigated share | Louisiana | 10.9% |
| Lowest mitigated share | Puerto Rico | 0.0% |
| Highest NFIP insured share | Florida | 58.0% |
| Lowest NFIP insured share | Puerto Rico | 2.8% |
Texas has the most properties and Louisiana the second most, but per resident Louisiana stands apart at 838.5 per 100,000 (FEMA, Census). The NFIP insured share runs from 58.0% in Florida to 2.8% in Puerto Rico, so a national share hides very different local pictures (FEMA).
Counties and ZIP codes
| County | Properties |
|---|---|
| Harris County, Texas | 19,904 |
| Jefferson Parish, Louisiana | 9,168 |
| Orleans Parish, Louisiana | 7,625 |
| Nassau County, New York | 6,631 |
| Lee County, Florida | 4,098 |
| St. Tammany Parish, Louisiana | 3,853 |
| Suffolk County, New York | 3,600 |
| Pinellas County, Florida | 3,297 |
| Galveston County, Texas | 3,278 |
| St. John the Baptist Parish, Louisiana | 2,539 |
| Baldwin County, Alabama | 2,508 |
| Miami-Dade County, Florida | 2,478 |
| Cape May County, New Jersey | 2,450 |
| Richmond County, New York | 2,399 |
| Jefferson County, Texas | 2,158 |
| ZIP code | State | Properties |
|---|---|---|
| 70068 | Louisiana | 2,458 |
| 70072 | Louisiana | 1,915 |
| 70458 | Louisiana | 1,422 |
| 36542 | Alabama | 1,408 |
| 11520 | New York | 1,224 |
| 08260 | New Jersey | 1,196 |
| 33931 | Florida | 1,048 |
| 32561 | Florida | 1,023 |
| 70125 | Louisiana | 1,014 |
| 70003 | Louisiana | 999 |
| 77096 | Texas | 969 |
| 11561 | New York | 964 |
| 23662 | Virginia | 899 |
| 70122 | Louisiana | 898 |
| 33703 | Florida | 897 |
The list spans 2,319 counties and 13,175 ZIP codes, yet the ten largest counties hold 26.6% of it and the 100 largest ZIP codes 26.2% (FEMA). Repeat flooding is a local pattern, which is why the county and ZIP view is more useful to a restoration firm or a local official than the state totals.
What the buildings are, and when they were built
| Building type | Properties | Share of list | Severe repetitive loss | Mitigated | NFIP insured now |
|---|---|---|---|---|---|
| Single-family home | 197,380 | 82.0% | 13.8% | 6.0% | 44.9% |
| Residential, 2 to 4 units | 12,147 | 5.0% | 14.3% | 3.1% | 32.7% |
| Residential, 5 or more units | 4,658 | 1.9% | 17.3% | 2.6% | 27.1% |
| Condo association building | 3,683 | 1.5% | 15.6% | 1.5% | 90.3% |
| Single unit in a multi-unit building | 786 | 0.3% | 8.9% | 1.1% | 82.6% |
| Mobile or manufactured home | 1,304 | 0.5% | 9.8% | 2.7% | 74.2% |
| Non-residential (codes 4, 6, 17, 18, 19) | 20,681 | 8.6% | 21.0% | 3.2% | 30.0% |
Single-family homes make up 82.0% of the list (FEMA). The highest severe flag share of any type belongs to non-residential buildings, 21.0% of a group that is 8.6% of the list (FEMA). Building type and claim size across all NFIP claims are in our flood loss by building type report.
The median construction year is 1970 and the largest decade is the 1970s, with 61,602 properties (FEMA). 62.5% were built before 1975, and 189,411 records (78.7%) are flagged pre-FIRM, meaning construction began before the community’s first flood map or before 1975, whichever is later (FEMA). Older buildings built before flood maps set elevation rules dominate the list.
Method
How we counted. We retrieved all 240,651 records of FEMA OpenFEMA NfipMultipleLossProperties v1 on 5 October 2026, matching the server-reported count; all share the as of date 2 August 2026. Each record is one property. Loss counts use totalLosses; every share is a simple proportion of records. Flood zones are grouped by first letter: A and V as the SFHA, B, C and X as outside it, D as undetermined; 5,609 records with no zone are shown separately and excluded from the outside-SFHA share. Construction decades exclude 10,392 records dated 1492 (a placeholder), 249 blanks and 27 years before 1800. ZIP codes are cut to five digits, with leading zeros restored on 8 records and 2,024 records without a usable ZIP left out of the ZIP table. State tables cover the 50 states, DC and Puerto Rico; 531 records with no state and territory records (AS 2, GU 16, VI 324) stay in national totals only. Per resident rates use Census Vintage 2025 population. State extremes require at least 1,000 properties.
Reproduce this
Reproduce this
- Endpoint
https://www.fema.gov/api/open/v1/NfipMultipleLossProperties- Query
$select=fipsCountyCode,state,stateAbbreviation,county,zipCode,nfipRl,nfipSrl,fmaRl,fmaSrl,asOfDate,floodZone,occupancyType,originalConstructionDate,postFIRMConstructionIndicator,primaryResidenceIndicator,mitigatedIndicator,insuredIndicator,totalLosses&$top=5000 paged with $skip- Rows retrieved
- 240,651 rows
- Retrieved
- 5 October 2026
No API key is required. Page at 5,000 rows with $top and $skip, and compare the total against $inlinecount=allpages before computing. Booleans arrive as true or false; the file is refreshed annually, so a later pull may differ.
What this does not show
What this does not show
- A snapshot, not a history. One as of date, 2 August 2026. Properties enter and leave the list.
- Insured means insured now. insuredIndicator is NFIP status on the file date, not at the time of any loss. Private flood insurance is not captured.
- Mitigated depends on FEMA records. It shows what FEMA has logged, not which mitigation was done.
- No dollar amounts. The public file holds loss counts, not claim payments, so it cannot rank properties by cost.
- Only NFIP claims count. Uninsured flooding, non-flood water damage and losses of $1,000 or less never enter totalLosses.
- No addresses. FEMA withholds them; ZIP is the finest unit used and nothing here identifies a property.
- Zone and occupancy come from the record. They may reflect the last rated policy rather than the current map or use.
Most quotable figures
- FEMA lists 240,651 repetitive loss properties nationwide (FEMA OpenFEMA NfipMultipleLossProperties, as of 2 August 2026).
- 56.4% of repetitive loss properties are not currently insured by the NFIP (FEMA OpenFEMA NfipMultipleLossProperties, as of 2 August 2026).
- 98.5% of the 34,996 severe repetitive loss properties are not recorded as mitigated (FEMA OpenFEMA NfipMultipleLossProperties, as of 2 August 2026).
- 50,084 repetitive loss properties sit in zones B, C or X, outside the mapped Special Flood Hazard Area (FEMA OpenFEMA NfipMultipleLossProperties, as of 2 August 2026).
- 3,049 buildings have 10 or more paid NFIP flood losses, and one has 63 (FEMA OpenFEMA NfipMultipleLossProperties, as of 2 August 2026).
- Louisiana has 839 repetitive loss properties per 100,000 residents (FEMA OpenFEMA, as of 2 August 2026; Census Vintage 2025 population).
Questions this report answers
What is a repetitive loss property?
Under FEMA’s NFIP definition, an insured structure with two or more claim payments of more than $1,000 each within any 10-year period. FEMA’s file flags 219,028 properties under that definition and 240,651 under at least one of four related definitions.
How many repetitive loss properties are there?
240,651 as of 2 August 2026, per FEMA. In the FEMA file Texas has 39,248, Louisiana 38,553 and Florida 33,589.
What makes a property severe repetitive loss?
Four or more claim payments above $5,000 each totalling more than $20,000, or two or more building payments that together exceed the building’s market value, per FEMA. FEMA flags 34,996 properties, 14.5% of the list.
Are repetitive loss properties still insured?
43.6% are NFIP insured as of the FEMA file date. Status at the time of each loss and private cover are not shown. Coverage questions belong with FEMA or FloodSmart.gov.
Can I check whether a specific address is on the list?
Not from the public file. FEMA withholds addresses, so this report goes no finer than ZIP code. Questions about a specific property belong with FEMA, the local floodplain administrator or the state NFIP coordinator.
How to cite
Remediation Insider. Repetitive Loss Properties: 240,651 Buildings That Keep Flooding. https://remediationinsider.com/repetitive-flood-loss-properties/ (retrieved 5 October 2026).
Data and tables in this report are released under CC BY 4.0. Attribution: Remediation Insider.
Sources
- Federal Emergency Management Agency. FEMA OpenFEMA NFIP Multiple Loss Properties, v1. 240,651 records, as of 2 August 2026, retrieved 5 October 2026. Source of the four category definitions and the occupancyType labels.
- FEMA flood zone definitions. Basis for grouping zones into inside and outside the SFHA.
- FEMA Flood Mitigation Assistance grant program. Context for the FMA repetitive loss flags.
- US Census Bureau population estimates, Vintage 2025. State resident population for per-resident rates.
- FEMA OpenFEMA Terms and Conditions.
- No survey, interview or physical inspection was conducted for this report. Every figure is computed at build time from the retrieved FEMA file.
This product uses the Federal Emergency Management Agency’s OpenFEMA API, but is not endorsed by FEMA. The Federal Government or FEMA cannot vouch for the data or analyses derived from these data after the data have been retrieved from the Agency’s website(s).