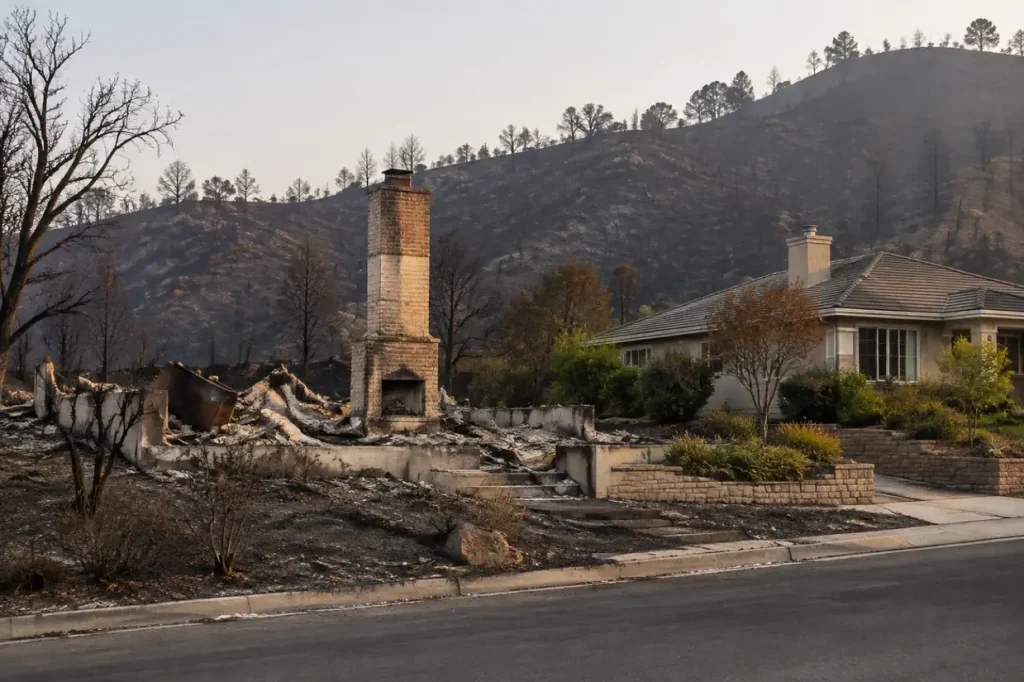
The finding
Any ranking of wildfire damage by state drawn from NOAA’s Storm Events Database is mostly a ranking of single fires. Of $30.2 billion in property damage recorded on 3,772 Wildfire records from 2015 to 2025, one record for the Camp Fire in November 2018 holds 56%, and California as a whole holds 63%. Only 20% of the records carry any dollar estimate above zero, so the totals below are a floor, not a measure.
Headline figures
In this report
- The state ranking, as recorded
- One record, half the ledger
- The largest episodes
- Deaths, and the fires with no dollar figure
- How much of the record has a number
- Amounts entered more than once
- Two fire seasons
- Year by year
- What FEMA declared
- FEMA dollars beside NOAA damage
- Smoke and soot: the damage nobody here counts
- Data treatment
- Method
- Reproduce this
- What this does not show
- Questions this report answers
- Sources
Key findings
- California accounts for $19.0 billion of the $30.2 billion in wildfire property damage NOAA recorded from 2015 to 2025, 63%. Hawaii is second with $5.6 billion (NOAA NCEI).
- A single record, the Camp Fire of November 2018, carries $17.0 billion, 56% of the national total. Remove that one episode and Hawaii leads with $5.6 billion, while California falls to rank 3 (NOAA NCEI).
- California and Hawaii recorded 346 of the 419 wildfire deaths, 83% (NOAA NCEI).
- 5 of the 10 deadliest wildfire episodes carry $0 in recorded property damage on every record, including the Palisades and Eaton fires of January 2025 with 58 deaths (NOAA NCEI).
- Only 748 of 3,772 Wildfire records (20%) carry a damage estimate above zero; 653 were left blank as not estimated and 2,371 read 0.00K (NOAA NCEI).
- 75 records repeat an amount already entered for the same fire in an earlier month, adding $954.6 million to the recorded total; Washington accounts for $810.0 million of it (NOAA NCEI).
- FEMA issued 532 Fire Management Assistance declarations from 2015 to 2025 against 30 major disaster declarations for fire, 94% of all fire declarations (FEMA OpenFEMA).
- In 13 of 29 states with FEMA fire aid, FEMA obligated more than NOAA recorded as damage. Oregon: $906.7 million from FEMA against $15.1 million in NOAA records (FEMA OpenFEMA, NOAA NCEI).
The state ranking, as recorded
NOAA logs wildfires by forecast zone, not by county, so the finest geography the file supports for a ranking is the state. The table lists every state and DC with at least one Wildfire record from 2015 to 2025, ranked by recorded property damage. Amounts are nominal estimates entered by National Weather Service staff under NWS Instruction 10-1605, Storm Data Preparation (26 July 2021). Source: NOAA NCEI Storm Events.
| State | Wildfire records | Episodes | Recorded damage | Share of US total | Records with estimate above $0 | Median positive estimate | Deaths |
|---|---|---|---|---|---|---|---|
| California | 577 | 402 | $19.0 billion | 63.0% | 15% | $200,000 | 243 |
| Hawaii | 93 | 85 | $5.6 billion | 18.4% | 5% | $1,000,000 | 103 |
| Colorado | 329 | 315 | $2.4 billion | 7.9% | 22% | $400,000 | 7 |
| Washington | 299 | 258 | $1.8 billion | 5.8% | 45% | $2,000,000 | 4 |
| Texas | 526 | 413 | $359.2 million | 1.2% | 11% | $100,000 | 8 |
| New Mexico | 72 | 65 | $216.8 million | 0.7% | 47% | $500,000 | 5 |
| Idaho | 225 | 211 | $206.8 million | 0.7% | 27% | $600,000 | 3 |
| Florida | 105 | 97 | $109.7 million | 0.4% | 21% | $75,000 | 1 |
| Arizona | 189 | 157 | $105.4 million | 0.3% | 17% | $325,000 | 1 |
| Utah | 56 | 55 | $98.6 million | 0.3% | 34% | $750,000 | 0 |
| Oklahoma | 390 | 208 | $94.1 million | 0.3% | 20% | $100,000 | 11 |
| Kansas | 63 | 38 | $67.9 million | 0.2% | 24% | $100,000 | 3 |
| Wyoming | 82 | 67 | $43.8 million | 0.1% | 13% | $500,000 | 1 |
| Nevada | 26 | 23 | $31.1 million | 0.1% | 27% | $100,000 | 0 |
| Louisiana | 13 | 10 | $23.7 million | 0.1% | 69% | $250,000 | 0 |
| Minnesota | 12 | 8 | $23.0 million | 0.1% | 33% | $4,970,000 | 0 |
| North Dakota | 4 | 3 | $19.9 million | 0.1% | 100% | $3,875,000 | 2 |
| Georgia | 18 | 14 | $18.5 million | 0.1% | 28% | $879,230 | 0 |
| Missouri | 32 | 23 | $15.7 million | 0.1% | 28% | $150,000 | 0 |
| Oregon | 311 | 277 | $15.1 million | 0.0% | 2% | $500,000 | 15 |
| Nebraska | 46 | 34 | $9.2 million | 0.0% | 48% | $65,000 | 4 |
| Montana | 111 | 69 | $3.9 million | 0.0% | 3% | $300,000 | 2 |
| Pennsylvania | 21 | 14 | $2.8 million | 0.0% | 24% | $1,500 | 1 |
| Tennessee | 4 | 4 | $2.6 million | 0.0% | 75% | $500,000 | 0 |
| Michigan | 6 | 6 | $2.2 million | 0.0% | 67% | $110,000 | 0 |
| Alaska | 26 | 17 | $2.1 million | 0.0% | 12% | $750,000 | 0 |
| Virginia | 6 | 4 | $1.6 million | 0.0% | 50% | $559,000 | 0 |
| North Carolina | 7 | 4 | $566,500 | 0.0% | 43% | $200,000 | 0 |
| New Jersey | 14 | 12 | $505,000 | 0.0% | 21% | $200,000 | 0 |
| Wisconsin | 12 | 11 | $390,000 | 0.0% | 58% | $57,000 | 2 |
| Arkansas | 6 | 4 | $335,000 | 0.0% | 50% | $50,000 | 1 |
| Iowa | 6 | 6 | $305,000 | 0.0% | 33% | $152,500 | 0 |
| New York | 4 | 4 | $136,000 | 0.0% | 50% | $68,000 | 0 |
| Massachusetts | 6 | 6 | $75,000 | 0.0% | 17% | $75,000 | 0 |
| Indiana | 5 | 5 | $35,000 | 0.0% | 60% | $10,000 | 0 |
| Mississippi | 4 | 3 | $30,000 | 0.0% | 50% | $15,000 | 0 |
| Illinois | 8 | 6 | $25,000 | 0.0% | 25% | $12,500 | 0 |
| West Virginia | 2 | 2 | $25,000 | 0.0% | 50% | $25,000 | 0 |
| South Carolina | 10 | 10 | $10,000 | 0.0% | 10% | $10,000 | 0 |
| South Dakota | 28 | 23 | $0 | 0.0% | 0% | n/a | 0 |
| Kentucky | 12 | 7 | $0 | 0.0% | 0% | n/a | 2 |
| Alabama | 1 | 1 | $0 | 0.0% | 0% | n/a | 0 |
| New Hampshire | 1 | 1 | $0 | 0.0% | 0% | n/a | 0 |
Island areas appear in the STATE column and are kept out of the ranking: Puerto Rico, 2 records and $400,000 recorded; Guam, 2 records and $0 recorded. No marine-zone Wildfire records occur in the window. Source: NOAA NCEI Storm Events.
One record, half the ledger
The Camp Fire entry of November 2018 is a single row carrying $17.0 billion. Together with the Maui and Big Island fires, including Lahaina (August 2023) and the Marshall Fire (December 2021), three episodes hold 81% of all recorded wildfire damage across 2,986 episodes (NOAA NCEI). The NOAA narrative for the Camp Fire calls it “most destructive wildfire in California history”. Source: NOAA NCEI Storm Events.
Take the Camp Fire out and the order changes: Hawaii $5.6 billion, Colorado $2.4 billion, California $2.0 billion, Washington $1.8 billion, Texas $359.2 million. California drops to rank 3. A state ranking over 11 years is therefore a statement about which states had a catastrophic fire in the window, more than about routine exposure. For the federal billion-dollar event list, which prices disasters on a different basis, see the billion-dollar disaster record. Source: NOAA NCEI Storm Events.
The largest episodes
NOAA groups records into episodes, one weather situation that may span several zones. A fire that burns for months is often entered as a new episode each month, so one fire can appear more than once below. Names are given only where the NOAA narrative for the episode states them. Source: NOAA NCEI Storm Events.
| Fire (as named in NOAA text) | State | Began | Records | Recorded damage | Deaths |
|---|---|---|---|---|---|
| Camp Fire | California | November 2018 | 1 | $17.0 billion | 86 |
| Maui and Big Island fires, including Lahaina | Hawaii | August 2023 | 3 | $5.6 billion | 102 |
| Marshall Fire | Colorado | December 2021 | 1 | $2.0 billion | 2 |
| Carr Fire and Mendocino Complex | California | July 2018 | 2 | $1.6 billion | 5 |
| Smokehouse Creek Fire and others | Texas | February 2024 | 14 | $310.3 million | 2 |
| East Troublesome Fire | Colorado | October 2020 | 1 | $166.6 million | 2 |
| Minnow Ridge Fire | Washington | October 2022 | 1 | $115.0 million | 0 |
| Minnow Ridge Fire | Washington | September 2022 | 1 | $115.0 million | 0 |
| Fire at Southwest Florida International Airport | Florida | April 2020 | 1 | $100.0 million | 0 |
| Hermits Peak and Calf Canyon Fire | New Mexico | May 2022 | 1 | $100.0 million | 0 |
Deaths, and the fires with no dollar figure
NOAA Wildfire records from 2015 to 2025 carry 419 deaths, 390 of them direct, and 846 injuries (NOAA NCEI). Only 20 states recorded any death. California and Hawaii hold 83% of deaths and 81% of recorded damage (NOAA NCEI). Source: NOAA NCEI Storm Events.
| State | Deaths | Direct | Indirect | Recorded damage |
|---|---|---|---|---|
| California | 243 | 235 | 8 | $19.0 billion |
| Hawaii | 103 | 103 | 0 | $5.6 billion |
| Oregon | 15 | 12 | 3 | $15.1 million |
| Oklahoma | 11 | 6 | 5 | $94.1 million |
| Texas | 8 | 8 | 0 | $359.2 million |
| Colorado | 7 | 7 | 0 | $2.4 billion |
| New Mexico | 5 | 5 | 0 | $216.8 million |
| Washington | 4 | 4 | 0 | $1.8 billion |
| Nebraska | 4 | 1 | 3 | $9.2 million |
| Idaho | 3 | 0 | 3 | $206.8 million |
| Kansas | 3 | 2 | 1 | $67.9 million |
| North Dakota | 2 | 2 | 0 | $19.9 million |
| Montana | 2 | 1 | 1 | $3.9 million |
| Wisconsin | 2 | 1 | 1 | $390,000 |
| Kentucky | 2 | 0 | 2 | $0 |
| Florida | 1 | 1 | 0 | $109.7 million |
| Arizona | 1 | 0 | 1 | $105.4 million |
| Wyoming | 1 | 1 | 0 | $43.8 million |
| Pennsylvania | 1 | 0 | 1 | $2.8 million |
| Arkansas | 1 | 1 | 0 | $335,000 |
| Fire (as named in NOAA text) | State | Began | Deaths | Recorded damage |
|---|---|---|---|---|
| Maui and Big Island fires, including Lahaina | Hawaii | August 2023 | 102 | $5.6 billion |
| Camp Fire | California | November 2018 | 86 | $17.0 billion |
| Palisades and Eaton fires | California | January 2025 | 58 | $0 |
| North Complex | California | September 2020 | 16 | $0 |
| Woolsey Fire | California | November 2018 | 15 | $0 |
| Unnamed in NOAA text (episode 120985) | California | October 2017 | 8 | $38.4 million |
| Beachie Creek, Holiday Farm and other fires | Oregon | September 2020 | 7 | $0 |
| Valley Fire and Butte Fire | California | September 2015 | 6 | $0 |
| Carr Fire and Mendocino Complex | California | July 2018 | 5 | $1.6 billion |
| Thomas Fire | California | December 2017 | 5 | $0 |
5 of these 10 episodes show 0.00K on every record. The episode for the Palisades and Eaton fires (January 2025) spans 8 zone records and 58 deaths, and every record reads zero (NOAA NCEI). In Storm Data a zero can mean no damage or damage not obtained, and the file does not say which (NCEI Storm Data bulk CSV format documentation). A damage ranking gives these fires no weight at all, which is why this report never reads a low NOAA total as low impact. NOAA reissues a year’s file when records are corrected, so later downloads may differ. Source: NOAA NCEI Storm Events.
How much of the record has a number
Most Wildfire records carry no price. Of 3,772 records, 653 (17%) leave DAMAGE_PROPERTY blank, meaning not estimated, 2,371 (63%) read 0.00K, and 748 (20%) carry an amount. The median positive estimate is $305,000 (NOAA NCEI). The most common reporting sources are Park/Forest Service (1,575), Fire Department/Rescue (785), Other Federal Agency (585), so many records start from land-management agencies. Source: NOAA NCEI Storm Events.
| State | Wildfire records | Blank (not estimated) | Recorded as 0.00K | Estimate above $0 |
|---|---|---|---|---|
| New Mexico | 72 | 18% | 35% | 47% |
| Washington | 299 | 4% | 52% | 45% |
| Utah | 56 | 4% | 62% | 34% |
| Idaho | 225 | 4% | 69% | 27% |
| Kansas | 63 | 43% | 33% | 24% |
| Colorado | 329 | 10% | 67% | 22% |
| Florida | 105 | 26% | 53% | 21% |
| Oklahoma | 390 | 18% | 62% | 20% |
| Arizona | 189 | 1% | 82% | 17% |
| California | 577 | 24% | 61% | 15% |
| Wyoming | 82 | 21% | 66% | 13% |
| Texas | 526 | 26% | 63% | 11% |
| Hawaii | 93 | 1% | 94% | 5% |
| Montana | 111 | 35% | 62% | 3% |
| Oregon | 311 | 8% | 90% | 2% |
The spread is wide: New Mexico prices 47% of its records and Oregon 2% (NOAA NCEI). Comparing two states’ totals therefore compares two reporting habits as much as two fire histories. Source: NOAA NCEI Storm Events.
Amounts entered more than once
Long fires produce a pattern that inflates the totals. When a fire burns across several months, the preparer often opens a new episode each month and enters the fire’s full dollar figure again. This report flags a record as a likely repeat when an earlier record in the same state and year has the identical amount and the same opening words in its event narrative, in a different episode. 75 records qualify, carrying $954.6 million (NOAA NCEI). Several of the narratives say only that “the cost of the fire is estimated”, so some amounts may include more than property damage; the file does not say. Source: NOAA NCEI Storm Events.
| State | Likely repeat records | Dollars in repeats | Recorded total | Total without repeats |
|---|---|---|---|---|
| Washington | 30 | $810.0 million | $1.8 billion | $956.8 million |
| Idaho | 12 | $71.8 million | $206.8 million | $135.0 million |
| Colorado | 26 | $36.1 million | $2.4 billion | $2.4 billion |
| Utah | 2 | $27.0 million | $98.6 million | $71.6 million |
| Georgia | 1 | $8.5 million | $18.5 million | $10.0 million |
| Texas | 1 | $500,000 | $359.2 million | $358.7 million |
| Wyoming | 1 | $500,000 | $43.8 million | $43.3 million |
| Nebraska | 1 | $250,000 | $9.2 million | $8.9 million |
| Arizona | 1 | $2,000 | $105.4 million | $105.4 million |
Washington is most affected: its recorded $1.8 billion falls to $956.8 million without likely repeats, 46% lower (NOAA NCEI). The rule is conservative and will miss repeats whose wording changed between months. Source: NOAA NCEI Storm Events.
A related question is what the dollar field prices. 100 priced Wildfire records, carrying $1.3 billion, describe a fire cost or firefighting cost in their own narrative, led by Washington (71), Idaho (17), Arizona (9) (NOAA NCEI). In at least one case the amount is plainly a firefighting figure: the Museum Fire (Arizona, July 2019) carries $9.0 million, and its narrative gives the same sum as spent on fire suppression. Storm Data asks for property damage, so these entries are best read as estimates of uncertain scope. Source: NOAA NCEI Storm Events.
Two fire seasons
Wildfire records peak in August (708 records, NOAA NCEI), but the calendar has two seasons. February to April holds 845 records (22%), led month by month by Oklahoma and Texas, the late-winter and spring season of the southern Plains. July to November holds 2,249 (60%), led each month by California. November has only 142 records but $17.0 billion of damage and 104 deaths, because the Camp Fire burned then. Source: NOAA NCEI Storm Events.
For the month-by-month pattern of restoration demand across all disaster types, see the restoration seasonality calendar.
Year by year
Annual recorded damage ranges from $22.9 million in 2015 to $18.8 billion in 2018 (NOAA NCEI). The swings follow single fires, and the share of records carrying an estimate also moves from year to year, so a trend cannot be read from 11 years of these figures. Source: NOAA NCEI Storm Events.
| Year | Records | With estimate above $0 | Recorded damage | Deaths | Costliest episode |
|---|---|---|---|---|---|
| 2015 | 284 | 16% | $22.9 million | 10 | Clearwater-Municipal fires and Lawyer Complex, Idaho |
| 2016 | 347 | 13% | $181.5 million | 6 | Unnamed in NOAA text (episode 104773), Kansas |
| 2017 | 358 | 16% | $156.0 million | 25 | Unnamed in NOAA text (episode 120985), California |
| 2018 | 417 | 13% | $18.8 billion | 116 | Camp Fire, California |
| 2019 | 197 | 14% | $28.1 million | 6 | Museum Fire, Arizona |
| 2020 | 413 | 9% | $458.7 million | 48 | East Troublesome Fire, Colorado |
| 2021 | 352 | 15% | $2.1 billion | 10 | Marshall Fire, Colorado |
| 2022 | 421 | 21% | $630.7 million | 18 | Minnow Ridge Fire, Washington |
| 2023 | 297 | 41% | $5.9 billion | 107 | Maui and Big Island fires, including Lahaina, Hawaii |
| 2024 | 336 | 33% | $1.1 billion | 10 | Smokehouse Creek Fire and others, Texas |
| 2025 | 350 | 29% | $788.9 million | 63 | Lower Sugarloaf Fire, Washington |
Partial year, not ranked: the 2026 file (StormEvents_details-ftp_v1.0_d2026_c20260918.csv.gz) held 267 Wildfire records, $72.1 million of recorded damage and 3 deaths at retrieval, with the latest record beginning in June 2026 (NOAA NCEI). Source: NOAA NCEI Storm Events.
What FEMA declared
FEMA has two very different tools for fire. A Fire Management Assistance (FM) declaration helps a state pay to fight a fire that threatens destruction on the scale of a major disaster, and it is approved while the fire is still burning (FEMA Fire Management Assistance Grant Program). A major disaster (DR) declaration follows the damage and opens recovery programmes. From 2015 to 2025, FEMA recorded 532 FM, 30 DR and 6 emergency (EM) declarations for incident type Fire, counted as distinct disaster numbers (FEMA OpenFEMA). FM declarations are approved within about a day, as the disaster declaration lag report shows, which makes them a fast count of fires that threatened communities, whether or not homes were lost. Source: FEMA OpenFEMA.
| State | FM declarations | Major disasters (DR) | Emergencies (EM) | NOAA Wildfire records |
|---|---|---|---|---|
| California | 111 | 10 | 4 | 577 |
| Washington | 62 | 6 | 1 | 299 |
| Oregon | 60 | 2 | 1 | 311 |
| Oklahoma | 36 | 2 | 0 | 390 |
| Arizona | 30 | 1 | 0 | 189 |
| Nevada | 29 | 0 | 0 | 26 |
| Texas | 24 | 0 | 0 | 526 |
| Montana | 22 | 1 | 0 | 111 |
| New Mexico | 22 | 2 | 0 | 72 |
| Colorado | 18 | 2 | 0 | 329 |
| Utah | 18 | 0 | 0 | 56 |
| Idaho | 12 | 0 | 0 | 225 |
| Kansas | 12 | 0 | 0 | 63 |
| Wyoming | 12 | 1 | 0 | 82 |
| Alaska | 10 | 0 | 0 | 26 |
| Hawaii | 9 | 1 | 0 | 93 |
| Florida | 8 | 0 | 0 | 105 |
| North Carolina | 7 | 0 | 0 | 7 |
| Louisiana | 4 | 0 | 0 | 13 |
| South Carolina | 4 | 0 | 0 | 10 |
| South Dakota | 4 | 0 | 0 | 28 |
| Tennessee | 4 | 1 | 0 | 4 |
| Georgia | 2 | 0 | 0 | 18 |
| Kentucky | 2 | 0 | 0 | 12 |
| North Dakota | 2 | 1 | 0 | 4 |
| Nebraska | 2 | 0 | 0 | 46 |
| Connecticut | 1 | 0 | 0 | 0 |
| Minnesota | 1 | 0 | 0 | 12 |
| New Hampshire | 1 | 0 | 0 | 1 |
| New Jersey | 1 | 0 | 0 | 14 |
| New York | 1 | 0 | 0 | 4 |
| Rhode Island | 1 | 0 | 0 | 0 |
California leads with 111 FM declarations, 21% of the national count (FEMA OpenFEMA). The two lists do not line up exactly: NOAA counts fire records by zone, FEMA counts requests a state made and FEMA approved. Source: FEMA OpenFEMA; NOAA NCEI.
FEMA dollars beside NOAA damage
FEMA Web Disaster Summaries report what was obligated or approved for each declaration. Across 568 fire declarations from 2015 to 2025, FEMA shows $9.4 billion: $8.0 billion in Public Assistance, $515.1 million in Individuals and Households Program aid and $932.2 million in Hazard Mitigation Grant Program funds (FEMA OpenFEMA). FM declarations account for $1.6 billion of it. These are federal outlays, not damage, and they keep rising for recent disasters. Source: FEMA OpenFEMA.
| State | FEMA fire aid | Of which FM | NOAA recorded damage |
|---|---|---|---|
| California | $6.2 billion | $957.4 million | $19.0 billion |
| Oregon | $906.7 million | $147.4 million | $15.1 million |
| Hawaii | $882.4 million | $1.5 million | $5.6 billion |
| New Mexico | $696.7 million | $19.7 million | $216.8 million |
| Washington | $216.5 million | $97.9 million | $1.8 billion |
| Colorado | $138.9 million | $35.8 million | $2.4 billion |
| Texas | $55.0 million | $55.0 million | $359.2 million |
| Utah | $54.0 million | $54.0 million | $98.6 million |
| Arizona | $50.6 million | $48.7 million | $105.4 million |
| Alaska | $36.7 million | $36.7 million | $2.1 million |
| Oklahoma | $36.1 million | $22.0 million | $94.1 million |
| Montana | $29.5 million | $24.8 million | $3.9 million |
| Louisiana | $29.5 million | $29.5 million | $23.7 million |
| Wyoming | $18.6 million | $9.3 million | $43.8 million |
| Idaho | $15.4 million | $15.4 million | $206.8 million |
The comparison is a check on the NOAA record, not a ratio of anything. In 13 of 29 states with FEMA fire aid, the federal outlay alone exceeds every dollar of wildfire damage NOAA recorded. The widest gap is Oregon: $906.7 million from FEMA against $15.1 million in NOAA records, where only 5 of 311 Wildfire records carry an amount above zero (FEMA OpenFEMA, NOAA NCEI). The largest fire declarations by FEMA aid are California 2018 (DR-4407, titled “Wildfires”), $2.2 billion; Hawaii 2023 (DR-4724, titled “Wildfires and high winds”), $880.8 million; Oregon 2020 (DR-4562, titled “Wildfires and straight-line winds”), $703.2 million; California 2017 (DR-4344, titled “Wildfires”), $673.6 million; California 2020 (DR-4558, titled “Wildfires”), $547.2 million. State-by-state spending across all incident types is in FEMA spending by state. Source: FEMA OpenFEMA.
Smoke and soot: the damage nobody here counts
For restoration work, the fires in these tables are the visible part. Smoke and soot can travel well beyond burned structures, into homes that never saw a flame, through attics, wall cavities and ventilation. None of the datasets used here measures that damage. NOAA records property damage per fire zone as one estimate; FEMA records federal aid by declaration. Neither counts smoke-affected homes, and no public dataset retrieved for this report does.
The practical side of that work, from scoping residue to odour removal, is covered in the fire and smoke damage section and the smoke damage repair guide. Burned slopes also change flood risk: NOAA logs flash floods on burn areas as their own cause, analysed in flash flood deaths by state.
Data treatment
| Rule | Records affected | Treatment |
|---|---|---|
| Blank DAMAGE_PROPERTY (not estimated) | 653 | Excluded from damage sums and medians; counted in record totals. |
| DAMAGE_PROPERTY recorded as 0.00K | 2,371 | Kept as zero; medians use positive estimates only. |
| Likely repeated monthly amounts | 75 | Kept in recorded totals ($954.6 million); shown separately. |
| Priced records describing a fire or firefighting cost | 100 | Kept ($1.3 billion); discussed in text. |
| Island areas in the STATE column | 4 | Reported separately, not ranked. |
| Marine or other non-state STATE values | 0 | Would be excluded. None occur. |
| Records keyed to a county (CZ_TYPE C) | 2 | Kept; all other Wildfire records are forecast zones. |
| Records with no event narrative | 746 | Counted; cannot be checked for repeats or names. |
| Duplicate EVENT_ID | 0 | None found. |
| Partial year 2026 | 267 | Excluded from every ranking; one labelled note. |
Method
How we counted. We downloaded the NOAA NCEI Storm Events details files for 2015 to 2026 on 6 October 2026 and kept records with EVENT_TYPE Wildfire (3,772 records from 2015 to 2025). DAMAGE_PROPERTY strings such as 300.00K were converted to dollars; blanks were treated as not estimated. Deaths are DEATHS_DIRECT plus DEATHS_INDIRECT. Episodes group on EPISODE_ID. Fire names come only from EPISODE_NARRATIVE and EVENT_NARRATIVE text, read from the same files. A record is flagged as a likely repeat when an earlier record in the same state and year has the identical amount and the same first 30 characters of event narrative in a different episode. For FEMA, we kept DisasterDeclarationsSummaries v2 rows with incidentType Fire and a declaration date from 2015 to 2025 (873 designated-area rows) and counted distinct disasterNumber values per state and declaration type. FEMA Web Disaster Summaries v1 supplied obligated PA, HMGP and approved IHP amounts for the same 568 declarations, of which 568 match the declaration file. Dollars are nominal and not inflation adjusted.
Reproduce this
Reproduce this
- Endpoint
https://www.ncei.noaa.gov/pub/data/swdi/stormevents/csvfiles/- Query
StormEvents_details-ftp_v1.0_d{YEAR}_c{STAMP}.csv.gz for 2015 to 2026; keep EVENT_TYPE == 'Wildfire'; parse DAMAGE_PROPERTY K/M/B suffixes; group on STATE and EPISODE_ID- Rows retrieved
- 3,772 Wildfire records, 2015 to 2025; 267 in the partial 2026 file
- Retrieved
- 6 October 2026
Files used, with the NCEI creation stamp (c) in each name: StormEvents_details-ftp_v1.0_d2015_c20260323.csv.gz, StormEvents_details-ftp_v1.0_d2016_c20260323.csv.gz, StormEvents_details-ftp_v1.0_d2017_c20260519.csv.gz, StormEvents_details-ftp_v1.0_d2018_c20260323.csv.gz, StormEvents_details-ftp_v1.0_d2019_c20260323.csv.gz, StormEvents_details-ftp_v1.0_d2020_c20260323.csv.gz, StormEvents_details-ftp_v1.0_d2021_c20260323.csv.gz, StormEvents_details-ftp_v1.0_d2022_c20260625.csv.gz, StormEvents_details-ftp_v1.0_d2023_c20260323.csv.gz, StormEvents_details-ftp_v1.0_d2024_c20260728.csv.gz, StormEvents_details-ftp_v1.0_d2025_c20260819.csv.gz, StormEvents_details-ftp_v1.0_d2026_c20260918.csv.gz. NCEI reissues a year’s file with a new c-stamp when records are corrected. Column meanings follow the NCEI Storm Data bulk CSV format documentation.
Reproduce this
- Endpoint
https://www.fema.gov/api/open/v2/DisasterDeclarationsSummaries- Query
$filter=declarationDate ge '2015-01-01'- Rows retrieved
- 26,032 rows, of which 873 are incident type Fire, 2015 to 2025
- Retrieved
- 23 September 2026
Keep incidentType Fire; count distinct disasterNumber per state and declarationType. No API key is required.
Reproduce this
- Endpoint
https://www.fema.gov/api/open/v1/FemaWebDisasterSummaries- Query
$top=5000 paged with $skip; join on disasterNumber- Rows retrieved
- 568 fire declarations matched
- Retrieved
- 5 October 2026
Sum totalObligatedAmountPa, totalAmountIhpApproved and totalObligatedAmountHmgp. Amounts change as FEMA obligates more for recent disasters.
What this does not show
What this does not show
- Damage is an estimate, often absent. NOAA amounts are entered by NWS preparers from agency, media and other reports, in nominal dollars. Most Wildfire records carry no amount above zero, and a zero does not prove there was no damage.
- Not a county ranking. Wildfire is recorded by NWS forecast zone, which does not map to counties.
- FEMA declarations measure federal response, not damage. A state that fights fires without requesting FEMA help, or whose request is denied, shows no declaration.
- FEMA dollars are to date. Obligations for recent declarations keep rising, and FEMA and NOAA years are assigned differently (declaration date against event date).
- No smoke, soot or ash damage. No dataset here counts homes damaged by smoke beyond the burn area.
- No insurance losses. Private insurance claims are not public at this level and are not used. For decisions about coverage or aid, consult FEMA, your state insurance department or state emergency management agency.
Most quotable figures
- California accounts for 63% of the $30.2 billion in US wildfire property damage recorded by NOAA from 2015 to 2025 (NOAA NCEI Storm Events).
- One NOAA record, the Camp Fire, holds 56% of all wildfire damage recorded nationwide from 2015 to 2025 (NOAA NCEI).
- Only 20% of NOAA Wildfire records from 2015 to 2025 carry a property damage estimate above zero (NOAA NCEI).
- 5 of the 10 deadliest US wildfire episodes from 2015 to 2025 carry $0 in NOAA recorded property damage (NOAA NCEI).
- FEMA issued 532 fire management declarations and 30 major disaster declarations for fire from 2015 to 2025 (FEMA OpenFEMA).
- Oregon received $906.7 million in FEMA fire aid for declarations from 2015 to 2025, against $15.1 million of wildfire damage in NOAA records (FEMA OpenFEMA, NOAA NCEI).
Questions this report answers
Which state has the most wildfire damage?
California, with $19.0 billion in NOAA recorded property damage from 2015 to 2025, 63% of the national total. The Camp Fire record alone accounts for $17.0 billion of it (NOAA NCEI).
How many people died in US wildfires in this period?
NOAA Storm Events records from 2015 to 2025 carry 419 wildfire deaths, 390 of them direct (NOAA NCEI).
Why do some major fires show no damage in NOAA data?
Damage is an estimate that preparers enter when they can obtain one. 653 Wildfire records are blank and 2,371 read 0.00K, which can mean no damage or damage not obtained (NOAA NCEI).
What is a FEMA fire management declaration?
A Fire Management Assistance declaration helps a state pay to fight a fire that threatens major-disaster destruction, approved while it burns. California had the most from 2015 to 2025, 111 (FEMA OpenFEMA).
Does this data include smoke damage to homes?
No. Neither NOAA Storm Events nor the FEMA files used here count homes damaged by smoke or soot outside the burn area.
How to cite
Remediation Insider. Wildfire Damage by State: NOAA and FEMA Records, 2015 to 2025. https://remediationinsider.com/wildfire-damage-by-state/ (retrieved 6 October 2026).
Data and tables in this report are released under CC BY 4.0. Attribution: Remediation Insider.
Sources
- NOAA National Centers for Environmental Information. NOAA NCEI Storm Events Database, bulk details files 2015 to 2026, csvfiles directory. Retrieved 6 October 2026.
- NOAA NCEI. NCEI Storm Data bulk CSV format documentation. Field definitions for DAMAGE_PROPERTY, fatality and narrative fields.
- National Weather Service. NWS Instruction 10-1605, Storm Data Preparation (26 July 2021). Direct and indirect fatalities (section 2.6) and damage estimates (section 2.7).
- Federal Emergency Management Agency. FEMA OpenFEMA, Disaster Declarations Summaries, v2. Declarations dated 1 January 2015 or later, retrieved 23 September 2026.
- Federal Emergency Management Agency. FEMA OpenFEMA, FEMA Web Disaster Summaries, v1. Retrieved 5 October 2026.
- FEMA Fire Management Assistance Grant Program, for the purpose and timing of FM declarations.
- No survey, interview or physical inspection was conducted for this report. Every figure is computed at build time from the retrieved public files.
This product uses the Federal Emergency Management Agency’s OpenFEMA API, but is not endorsed by FEMA. The Federal Government or FEMA cannot vouch for the data or analyses derived from these data after the data have been retrieved from the Agency’s website(s).