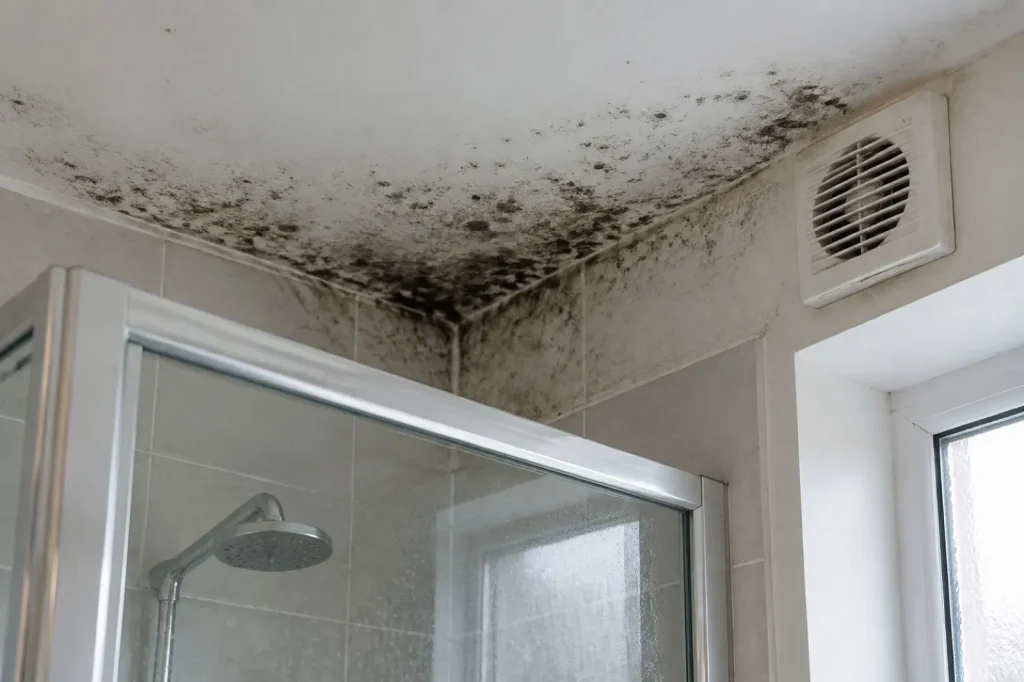
The finding
The percentage of homes with mold in the United States is about 3% on the federal government’s own measure: an estimated 3.9 million of the 132.2 million occupied homes that answered the 2023 American Housing Survey (3.0%) reported mold covering at least the area of a sheet of letter paper in the previous 12 months. Mold was far more common where water had leaked: 10.6% of homes with a leak in the same 12 months reported mold, against 1.6% of homes with no leak, 6.7 times the rate. Census Bureau and HUD data, 48,163 sample homes.
Headline figures
What counts as a home with mold here. The 2023 AHS Definitions describe the item this way: respondents “were asked if in the last 12 months mold was covering an area greater or equal to the size of an 8 1/2″ x 11″ piece of paper in your home and if the mold was in the kitchen, bathrooms, bedrooms, living room, or some other room.” The interview also lists the basement as a room choice. Four limits follow from that wording: the mold had to be seen, it had to reach the size of a sheet of letter paper, it had to appear within the 12 month window, and the household itself reported it. Vacant homes were not asked.
Of 48,527 occupied sample homes, 364 did not answer the mold item and are left out of every rate. Against all 133.2 million occupied homes, including those that did not answer, the same 3.9 million homes are 2.9%. Source: Census Bureau and HUD, American Housing Survey 2023 national PUF v1.1, weighted, retrieved 6 October 2026.
In this report
Key findings
- An estimated 3.9 million occupied homes, 3.0% of those that answered, reported mold at least the size of a sheet of letter paper in the past 12 months (Census AHS 2023).
- Bathrooms come first: 47.5% of homes with mold reported it in a bathroom, about 1.9 million homes. Bedroom(s) was next at 23.2%.
- Homes with any water leak in the past 12 months reported mold at 10.6%, against 1.6% for homes with no leak, a ratio of 6.7 to 1 (Census AHS 2023).
- Not every mold home had a leak: 55% of homes with mold also reported a leak, so 45% reported mold without any leak in the same 12 months (Census AHS 2023).
- Among leak sources, leaks through walls, closed windows or doors went with the highest mold rate, 18.8%, and leaks through the basement with the lowest, 8.3% (Census AHS 2023).
- Renters reported mold at 5.1% and owners at 1.9%, a ratio of 2.7 to 1.
- By census division the rate runs from 1.8% (West North Central and Mountain) to 3.9% (East South Central). The national file carries no state identifier, so no state figures are possible.
Which rooms the mold was in
The survey asked households with mold to name every room it was in, so one home can count in several rows. Bathrooms come first by a wide margin: 47.5% of mold homes named a bathroom, which is 1.4% of all answering homes. The basement is named least, by 9.9% of mold homes, but that share counts every home, including the many with no basement. Among the 11,714 sample homes recorded with a basement under all or part of the house (AHS FOUNDTYPE 1 or 2), 1.0% reported basement mold. All 133 sample homes with basement mold fall in that group. Source: Census Bureau and HUD, American Housing Survey 2023 national PUF v1.1, weighted, retrieved 6 October 2026.
| Room | Sample homes | Estimated homes | Share of all homes | Share of homes with mold |
|---|---|---|---|---|
| Bathroom(s) | 898 | 1.9 million | 1.41% | 47.5% |
| Bedroom(s) | 437 | 0.9 million | 0.69% | 23.2% |
| Kitchen | 344 | 0.7 million | 0.56% | 18.8% |
| Some other room(s) | 228 | 0.7 million | 0.50% | 16.8% |
| Living room | 268 | 0.6 million | 0.45% | 15.2% |
| Basement | 133 | 0.4 million | 0.29% | 9.9% |
Most homes with mold reported it in a single room: 80.9% named one room, and the rest named two or more. That matters for anyone reading the headline figure as a measure of whole-house contamination. The typical case in this survey is one room, most often a bathroom. Source: Census Bureau and HUD, American Housing Survey 2023 national PUF v1.1, weighted, retrieved 6 October 2026.
The leak connection
The AHS asks every occupied home whether water leaked in from outside (roof, basement, walls, closed windows or doors) or from inside (pipes, backed up fixtures, a water heater) in the past 12 months. The same reference window as the mold item makes the two directly comparable. Homes that reported any leak had a mold rate of 10.6%. Homes with no leak had 1.6%. On these two weighted shares a home with a leak was 6.7 times as likely to report mold. Source: Census Bureau and HUD, American Housing Survey 2023 national PUF v1.1, weighted, retrieved 6 October 2026.
| Group | Sample homes | Sample homes with mold | Share with mold | Per 1,000 homes |
|---|---|---|---|---|
| No leak reported | 40,837 | 768 | 1.6% | 16 |
| Inside leak only | 3,285 | 352 | 9.3% | 93 |
| Outside leak only | 3,164 | 321 | 9.2% | 92 |
| Leaks from inside and outside | 877 | 229 | 20.4% | 204 |
Homes that reported both an inside and an outside leak had the highest rate, 20.4%. In absolute terms an estimated 2.1 million homes reported both a leak and mold in the same 12 months. Those are the homes where a water damage job and a mold job are most likely to be the same job. The data cannot say which came first: both items cover the same 12 months without dates.
By where the water came from
Households with a leak named every source that applied. The table ranks the sources by the share of those homes reporting mold anywhere in the home.
| Group | Sample homes | Sample homes with mold | Share with mold | Per 1,000 homes |
|---|---|---|---|---|
| Outside: walls, closed windows or doors | 976 | 220 | 18.8% | 188 |
| Inside: pipes leaked | 1,827 | 298 | 13.8% | 138 |
| Outside: through the roof | 2,017 | 286 | 12.9% | 129 |
| Inside: own fixtures backed up or overflowed | 995 | 159 | 12.2% | 122 |
| Inside: other source | 1,095 | 142 | 11.2% | 112 |
| Outside: somewhere else | 533 | 78 | 11.0% | 110 |
| Inside: broken water heater | 378 | 54 | 9.4% | 94 |
| Outside: through the basement | 853 | 83 | 8.3% | 83 |
Homes reporting leaks through walls, closed windows or doors had the highest mold rate, 18.8%, and homes reporting leaks through the basement the lowest, 8.3%. The survey records the source of the water and the room of the mold separately, so it cannot link a given leak to a given patch of mold. The companion household water leak report breaks down the leaks themselves. Source: Census Bureau and HUD, American Housing Survey 2023 national PUF v1.1, weighted, retrieved 6 October 2026.
The reverse view is just as useful. Of the homes that reported mold, 54.9% also reported a leak in the same 12 months. The other 45.1% did not. The survey does not ask about other moisture sources, such as condensation or humidity from showers, so it cannot say what lies behind mold in those homes. Source: Census Bureau and HUD, American Housing Survey 2023 national PUF v1.1, weighted, retrieved 6 October 2026.
Owners, renters and the kind of building
Renters reported mold at 5.1%, owners at 1.9%. The survey cannot separate the effect of tenure from the kinds of buildings renters live in, their age or household income; each row below is a simple one-way split. The owner renter damage gap report covers the same divide in FEMA flood claims. Source: Census Bureau and HUD, American Housing Survey 2023 national PUF v1.1, weighted, retrieved 6 October 2026.
| Group | Sample homes | Sample homes with mold | Share with mold | Per 1,000 homes |
|---|---|---|---|---|
| Owner | 28,017 | 490 | 1.9% | 19 |
| Renter | 19,551 | 1,159 | 5.1% | 51 |
| Occupied without rent | 595 | 21 | suppressed (too few cases) | suppressed |
By building type, the highest rate was 6.5% (group: Building with 5 to 19 apartments) and the lowest 2.1% (group: One-family house, detached). 25 sample homes coded as a boat, RV or van are left out of this table. For how building type shapes flood losses, see flood loss by building type, from NFIP claims. Source: Census Bureau and HUD, American Housing Survey 2023 national PUF v1.1, weighted, retrieved 6 October 2026.
| Group | Sample homes | Sample homes with mold | Share with mold | Per 1,000 homes |
|---|---|---|---|---|
| Mobile home or trailer | 1,967 | 77 | 4.5% | 45 |
| One-family house, detached | 27,462 | 560 | 2.1% | 21 |
| One-family house, attached | 3,440 | 135 | 3.2% | 32 |
| Building with 2 to 4 apartments | 3,831 | 232 | 4.8% | 48 |
| Building with 5 to 19 apartments | 4,985 | 346 | 6.5% | 65 |
| Building with 20 or more apartments | 6,453 | 320 | 3.6% | 36 |
Age of the home
Mold reporting does not simply rise with the age of the home. The highest rate is for homes built 1920 to 1939 (4.2%) and the lowest for homes built 2010 or later (1.2%). Year built is reported by the household in ranges (AHS Items Booklet, items BUILTQ and DECADEQ). Source: Census Bureau and HUD, American Housing Survey 2023 national PUF v1.1, weighted, retrieved 6 October 2026.
| Group | Sample homes | Sample homes with mold | Share with mold | Per 1,000 homes |
|---|---|---|---|---|
| 1919 or earlier | 2,612 | 126 | 3.8% | 38 |
| 1920 to 1939 | 3,024 | 144 | 4.2% | 42 |
| 1940 to 1959 | 6,684 | 282 | 3.4% | 34 |
| 1960 to 1979 | 12,254 | 509 | 3.5% | 35 |
| 1980 to 1999 | 12,491 | 403 | 3.1% | 31 |
| 2000 to 2009 | 6,471 | 140 | 1.8% | 18 |
| 2010 or later | 4,627 | 66 | 1.2% | 12 |
Household income
Income is household income in the 12 months before the interview (AHS code HINCP). The rate runs from 4.5% in the Under $25,000 band to 1.7% in the $100,000 to $149,999 band. 1 answering home with a negative income is kept in the lowest band. Source: Census Bureau and HUD, American Housing Survey 2023 national PUF v1.1, weighted, retrieved 6 October 2026.
| Group | Sample homes | Sample homes with mold | Share with mold | Per 1,000 homes |
|---|---|---|---|---|
| Under $25,000 | 11,263 | 638 | 4.5% | 45 |
| $25,000 to $49,999 | 8,210 | 364 | 4.0% | 40 |
| $50,000 to $74,999 | 6,993 | 217 | 2.9% | 29 |
| $75,000 to $99,999 | 5,212 | 132 | 2.5% | 25 |
| $100,000 to $149,999 | 6,883 | 127 | 1.7% | 17 |
| $150,000 or more | 9,602 | 192 | 2.0% | 20 |
Homes with children
Homes with at least one child under 18 reported mold at 3.6%, against 2.7% for homes without children. Children are counted with the AHS codes NUMYNGKIDS (under 6) and NUMOLDKIDS (6 to 17), as in the Census table specification. The survey records mold in the home, not anyone’s health. Source: Census Bureau and HUD, American Housing Survey 2023 national PUF v1.1, weighted, retrieved 6 October 2026.
| Group | Sample homes | Sample homes with mold | Share with mold | Per 1,000 homes |
|---|---|---|---|---|
| Child under 6 present | 4,886 | 262 | 4.6% | 46 |
| Children 6 to 17 only | 7,766 | 313 | 2.9% | 29 |
| No children under 18 | 35,511 | 1,095 | 2.7% | 27 |
Mold by census division
The national file identifies the nine census divisions, not states, so no state figure can be computed from it. The spread between divisions is 3.9% in East South Central to 1.8% in West North Central and Mountain. The highest division’s own 90% margin of error is 0.8 points, and the gap between the highest and lowest division clears the combined margin, so small gaps between neighbouring divisions should not be read as real differences. Source: Census Bureau and HUD, American Housing Survey 2023 national PUF v1.1, weighted, retrieved 6 October 2026.
| Group | Sample homes | Sample homes with mold | Share with mold | Per 1,000 homes |
|---|---|---|---|---|
| East South Central | 1,975 | 97 | 3.9% | 39 |
| Pacific | 9,735 | 358 | 3.5% | 35 |
| Middle Atlantic | 5,379 | 274 | 3.2% | 32 |
| New England | 3,057 | 107 | 3.1% | 31 |
| West South Central | 6,205 | 208 | 3.1% | 31 |
| South Atlantic | 9,691 | 328 | 3.0% | 30 |
| East North Central | 7,011 | 191 | 2.7% | 27 |
| West North Central | 1,892 | 46 | 1.8% | 18 |
| Mountain | 3,218 | 61 | 1.8% | 18 |
Why this figure is lower than many online claims
Figures that circulate online often put mold in a large share of homes, and they rarely say what was counted. A count built on spores or any trace of growth answers a broader question. The US EPA states that “it is impossible to get rid of all mold and mold spores indoors; some mold spores will be found floating through the air and in house dust.” On that kind of definition nearly every home has mold. The AHS measures something narrower and easier to defend: visible mold the household itself noticed, at least the size of a sheet of letter paper, within 12 months. On that measure the national rate is 3.0%. Both kinds of number can be true at once; they answer different questions. Source: Census Bureau and HUD, American Housing Survey 2023 national PUF v1.1, weighted, retrieved 6 October 2026.
The narrow definition also leaves things out. Mold hidden inside walls, under flooring or in attics, crawl spaces and garages would not be seen and counted, and a household may not report mold it cleaned up quickly. The AHS figure is best read as a floor for visible, household-noticed mold, not as a count of every home with a moisture problem.
The survey has no dates inside its 12 month window, so it cannot show when in the year mold appears. For the timing of water and storm work, the restoration seasonality calendar and the restoration demand volatility index draw on FEMA and NOAA records instead.
Checked against the Census published estimates
Census publishes a verification workbook that lists its own Table Creator estimate and 90% margin of error for each published table cell. Our weighted count of homes with mold matches it: 3,908 thousand, with a margin of error of 218 thousand. Those published margins cover the cells below. For our own cross-tabulations the headline margins in Method are computed from the 160 replicate weights in the file. Source: Census Bureau and HUD, American Housing Survey 2023 national PUF v1.1, weighted, retrieved 6 October 2026.
| Row | Our PUF estimate (thousands) | Census PUF estimate (thousands) | Census Table Creator estimate (thousands) | Census 90% margin of error (thousands) |
|---|---|---|---|---|
| Any room (homes with mold) | 3,908 | 3,908 | 3,908 | 218 |
| Bathroom(s) | 1,857 | 1,857 | 1,857 | 147 |
| Kitchen | 736 | 736 | 736 | 92 |
| Bedroom(s) | 909 | 909 | 909 | 94 |
| Living room | 592 | 592 | 592 | 83 |
| Some other room(s) | 655 | 655 | 655 | 95 |
| Basement | 389 | 389 | 389 | 69 |
| Mold item not reported | 1,039 | 1,039 | 1,039 | 115 |
Method
How we counted. We read the 2023 American Housing Survey national public use file (v1.1, household file, 55,669 records) and kept the 48,527 occupied homes (TENURE 1, 2 or 3). A home counts as having mold when any of the six room items (MOLDBATH, MOLDKITCH, MOLDBEDRM, MOLDLROOM, MOLDBASEM, MOLDOTHER) is 1, and as having none when all six are 2. 364 homes coded -9 (not reported) on all six items were dropped from every denominator, leaving 48,163 answering homes, 1,670 of them with mold. Every estimate uses the household WEIGHT. A leak means LEAKI or LEAKO equal to 1, the AHS items for water leaking from inside or outside in the past 12 months. Code meanings come from the Census AHS 2023 Value Labels Package and question concepts from the 2023 AHS Definitions and Items Booklet. Margins of error at 90% come from the 160 replicate weights in the PUF, using the Census AHS formula (variance equals 4/160 times the sum of squared replicate deviations): the national share is 3.0% plus or minus 0.2 points; homes with a leak 10.6% plus or minus 0.8; homes without 1.6% plus or minus 0.1. The leak gap and the renter to owner gap both clear their margins. Table cells show sample counts rather than margins. A share is published only when its group rests on at least 100 unweighted sample homes and at least 30 of them report mold, and the sample counts are shown in every table. Ratios such as 6.7 to 1 are the ratio of two weighted shares.
Reproduce this
Reproduce this
- Endpoint
https://www2.census.gov/programs-surveys/ahs/2023/AHS%202023%20National%20PUF%20v1.1%20CSV.zip- Query
household.csv; keep TENURE in ('1','2','3'); columns WEIGHT, MOLDBATH, MOLDKITCH, MOLDBEDRM, MOLDLROOM, MOLDOTHER, MOLDBASEM, LEAKI, LEAKO, BLD, YRBUILT, DIVISION, HINCP, NUMYNGKIDS, NUMOLDKIDS; strip single quotes from codes- Rows retrieved
- 48,527 occupied of 55,669 household records
- Retrieved
- 6 October 2026
The zip is a direct download from the Census Bureau and needs no key. Codes are stored in single quotes in the CSV. A weighted count of homes with any mold flag equal to 1 should match the Census verification workbook row “Housing units with mold in last 12 months”.
What this does not show
What this does not show
- Self-reported. The household says whether it saw mold. Nobody inspected or sampled the home.
- Visible mold only, above a size threshold. Mold smaller than a sheet of letter paper, or hidden in walls, attics or crawl spaces, is not counted.
- A 12 month window. The figure is mold in the past 12 months, not mold today and not mold ever.
- Sampling error. These are survey estimates. Census publishes a margin of error of 218 thousand homes for the national count, and Method gives replicate margins for the headline shares. Table cells carry wider uncertainty, especially those resting on few mold cases.
- Association, not cause. Leak and mold are both reported for the same 12 months without dates. The data cannot show that a leak caused the mold, or which came first. One-way splits (tenure, income, age) are not adjusted for each other.
- National and division level only. The national PUF has no state identifier, so no state ranking is possible.
- No health or cost data. The survey records mold in the home, not health effects or what removal cost. For health questions see the EPA and CDC guidance listed in Sources.
Most quotable figures
- An estimated 3.0% of US occupied homes, about 3.9 million, reported mold at least the size of a sheet of letter paper in the past 12 months (Census American Housing Survey 2023).
- US homes with a water leak in the past 12 months were 6.7 times as likely to report mold as homes with no leak: 10.6% against 1.6% (Census AHS 2023, analysis by Remediation Insider).
- 48% of US homes reporting mold had it in a bathroom (Census AHS 2023).
- About 2.1 million US homes reported both a water leak and mold in the same 12 months (Census AHS 2023).
- 45% of US homes reporting mold reported no water leak in the same 12 months (Census AHS 2023).
- Renters reported mold at 5.1% and homeowners at 1.9% (Census AHS 2023).
Questions this report answers
What percentage of homes have mold?
On the American Housing Survey measure, 3.0% of occupied US homes that answered, an estimated 3.9 million, reported mold at least the size of a sheet of letter paper in the past 12 months (Census AHS 2023).
Why do some sources say most homes have mold?
They usually count mold spores or any growth found by sampling. Spores are common indoors. The AHS counts visible mold a household noticed above a size threshold, a narrower question.
Which room is mold most often found in?
Bathrooms. 47.5% of homes reporting mold named a bathroom; bedroom(s) was next at 23.2% (Census AHS 2023).
Are homes with leaks more likely to have mold?
Yes, in this survey. 10.6% of homes with a leak in the past 12 months reported mold, against 1.6% of homes without one. The survey does not show which came first (Census AHS 2023).
Is there a state by state figure?
Not from this file. The national AHS public use file identifies census divisions, not states, so this report shows divisions only.
What should I do if I find mold at home?
This report describes survey data and gives no remediation, health or insurance advice. The EPA and CDC publish guidance on mold in homes, and state or local health departments can advise on specific situations.
How to cite
Remediation Insider. Percentage of Homes With Mold: What the American Housing Survey Shows. https://remediationinsider.com/homes-with-mold-report/ (retrieved 6 October 2026).
Data and tables in this report are released under CC BY 4.0. Attribution: Remediation Insider.
Sources
- US Census Bureau and US Department of Housing and Urban Development. American Housing Survey 2023 Public Use File, national PUF v1.1 (CSV). Retrieved 6 October 2026.
- 2023 AHS Definitions, entries for mold and water leakage during last 12 months.
- 2023 AHS Items Booklet, items MOLD, MLDROOM, LEAK1, LEAK2, WHERELK, ILEAK1, ILEAK2 and WHERELK2.
- AHS 2023 Value Labels Package, for the codes of BLD, YRBUILT, DIVISION, TENURE and the mold and leak items.
- AHS 2023 Table Specifications and PUF Estimates for User Verification, Housing Quality and Demographics sheets. Retrieved 6 October 2026.
- US EPA, A Brief Guide to Mold, Moisture and Your Home, quoted on spores, and CDC, Mold and Your Health, for health and clean-up guidance this report does not give.
- No survey, interview or physical inspection was conducted for this report. Every figure is computed from the retrieved public files.