The finding
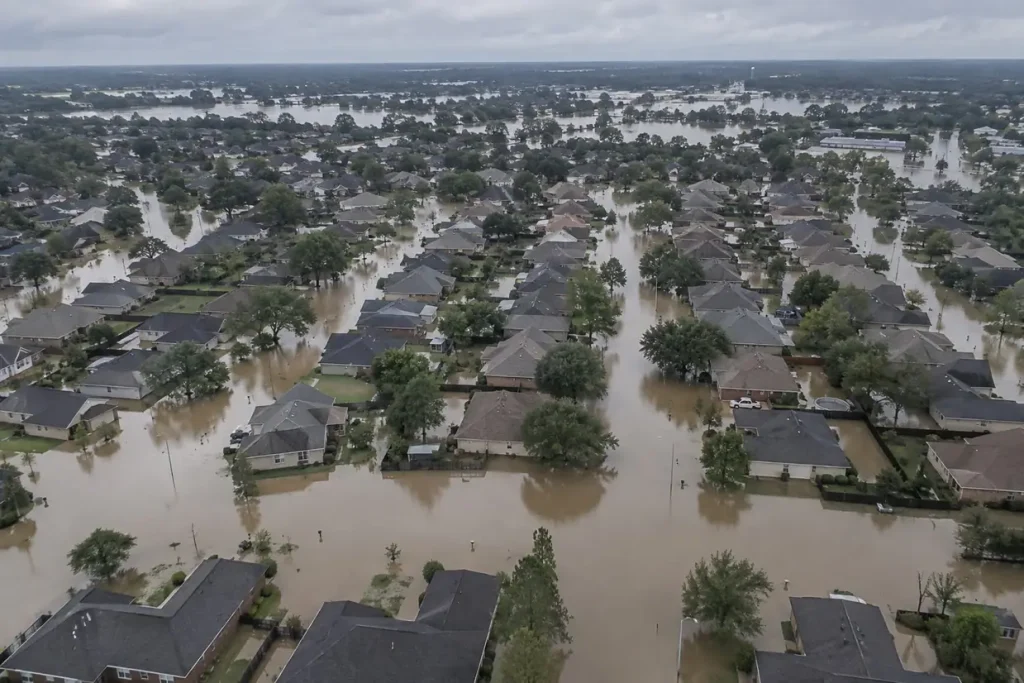
Flood claims by state concentrate far more tightly than population does. Across 491,235 National Flood Insurance Program building claims with a loss year of 2015 or later, Florida, Texas and Louisiana account for 67.8% of the national total between them. Ranked by claims per 100,000 residents the leader changes to Louisiana at 1,298 claims per 100,000, and 4 of the twelve most exposed states per head do not appear in the twelve largest by raw count at all.
Headline figures
In this report
Key findings
- Florida files the most NFIP building claims of any state, 153,321 since 2015, which is 31.2% of the national total.
- Normalised for population, Louisiana leads instead, at 1,298 claims per 100,000 residents against 656 for Florida.
- 4 states appear in the top twelve by claims per 100,000 residents but not in the top twelve by raw count: Mississippi, West Virginia, Vermont, Alabama.
- Median building damage per claim ranges from $5,536 in Colorado to $55,416 in Texas, a spread of 10.0 times across states with at least 300 claims.
- The national median building damage amount, $36,429 per claim, sits above the median of the 44 ranked state medians ($15,389), because the three highest-volume states also carry the highest median damage.
- New Jersey records 137.3 NFIP claims per county-level federal disaster declaration since 2015, against 1.0 in Puerto Rico, a gap of roughly 138 times.
- Total paid on building claims in this sample is $31,406,455,509 across 52 states and territories with at least one qualifying claim.
Where the claims are
Three Gulf and South Atlantic states hold 67.8% of every qualifying claim in the file. That is a function of coastline, hurricane exposure and NFIP policy counts all pulling in the same direction, and it means any national average computed from this dataset is substantially a statement about Florida, Texas and Louisiana. Our report on flood insurance cost by state shows what those NFIP policies cost in each state.
Per head, the ranking changes
This is the more useful ranking for anyone deciding where flood work is dense rather than merely plentiful. Louisiana records 1,298 claims per 100,000 residents, roughly 2.0 times Florida on the same measure, despite filing 2.6 times fewer claims in absolute terms.
The states that enter on a per-head basis are Mississippi, West Virginia, Vermont, Alabama. They are small enough that raw counts bury them, and in several cases the exposure is riverine and inland rather than coastal. The states that drop out going the other way are New York, Pennsylvania, Georgia, California, which file many claims because they are populous.
| State | Rank by count | Rank per 100k | Claims | Claims per 100,000 |
|---|---|---|---|---|
| Louisiana | 3 | 1 | 59,681 | 1,298.1 |
| Florida | 1 | 2 | 153,321 | 656.0 |
| Texas | 2 | 3 | 119,991 | 383.5 |
| South Carolina | 5 | 4 | 17,053 | 311.3 |
| North Carolina | 4 | 5 | 28,055 | 254.0 |
| Mississippi | 15 | 6 | 4,621 | 157.0 |
| West Virginia | 20 | 7 | 2,707 | 152.9 |
| Vermont | 33 | 8 | 929 | 143.3 |
| Kentucky | 10 | 9 | 5,872 | 128.0 |
| New Jersey | 6 | 10 | 11,943 | 125.7 |
| Missouri | 9 | 11 | 6,360 | 101.8 |
| Alabama | 14 | 12 | 4,703 | 91.2 |
Median damage varies more than people expect
Claim frequency and claim size are different questions, and they do not rank the same way. Among states with at least 300 qualifying claims, median building damage runs from $5,536 in Colorado to $55,416 in Texas. The national median across all claims is $36,429, which is higher than the median state median of $15,389 because the highest-volume states are also among the most expensive per claim.
| State | Claims | Median building damage | Mean building damage | Median depth (ft) |
|---|---|---|---|---|
| Texas | 119,991 | $55,416 | $77,241 | 1.0 |
| Florida | 153,321 | $54,919 | $90,582 | 1.0 |
| Louisiana | 59,681 | $52,489 | $62,023 | 1.0 |
| Hawaii | 1,196 | $29,819 | $62,991 | 1.0 |
| Oklahoma | 1,783 | $27,960 | $47,346 | 1.0 |
| Arkansas | 2,230 | $27,506 | $44,940 | 1.0 |
| Puerto Rico | 724 | $26,526 | $41,071 | 1.0 |
| New Mexico | 445 | $25,929 | $60,366 | 0.0 |
| Vermont | 929 | $22,987 | $58,083 | 0.0 |
| Maine | 1,070 | $22,503 | $41,744 | 1.0 |
| Missouri | 6,360 | $20,972 | $45,827 | 2.0 |
| Washington | 2,656 | $20,656 | $43,558 | 1.0 |
Three things plausibly drive that spread, and the dataset lets us check one directly: median recorded water depth is deeper in the high-median states, and our companion report on the water depth damage curve shows median damage rising steeply through the first two feet. Building stock is the second factor, because slab-on-grade housing with floor-level mechanical plant loses more at shallow depth than a raised or basement-heavy structure does. Flood type is the third: coastal surge carries salt water, longer dwell time and wind damage alongside the depth reading, and an inland flash flood does not.
Declarations against claims
A federal disaster declaration and an insurance claim measure different things. Declarations count events that crossed a damage threshold at county level. Claims count policyholders who were both flooded and insured. Dividing one by the other gives a rough index of how much flood loss in a state reaches the NFIP.
| State | NFIP claims | County declarations 2015 to 2025 | Claims per declaration |
|---|---|---|---|
| New Jersey | 11,943 | 87 | 137.3 |
| Florida | 153,321 | 1,183 | 129.6 |
| Pennsylvania | 7,140 | 64 | 111.6 |
| Texas | 119,991 | 1,219 | 98.4 |
| Illinois | 4,479 | 73 | 61.4 |
| Louisiana | 59,681 | 1,126 | 53.0 |
| Oregon | 554 | 173 | 3.2 |
| Oklahoma | 1,783 | 587 | 3.0 |
| Minnesota | 586 | 221 | 2.7 |
| South Dakota | 500 | 254 | 2.0 |
| Kansas | 883 | 473 | 1.9 |
| Puerto Rico | 724 | 727 | 1.0 |
New Jersey sits at the top with 137.3 claims per declaration: a small number of declared events, each producing a large volume of insured claims, which is what dense coastal policy penetration looks like. Puerto Rico sits at the bottom with 1.0, meaning many declared county events and comparatively few NFIP claims arising from them.
The low end is the more interesting reading. A state can be declared repeatedly and still produce few flood claims, for three reasons that are not contradictions. Flood insurance take-up outside mapped high-risk zones is low, so the damage exists but is uninsured. Many declarations cover events that are not floods, including severe storms, tornadoes, wildfire and winter weather. And inland flooding often damages a smaller share of properties in a declared county than coastal surge does. A wide gap points to uninsured exposure or a non-flood loss mix, not to an error in either dataset.
Every state in one table
| State | Claims | Claims per 100,000 | Median building damage | Mean building damage | Total paid on building claims |
|---|---|---|---|---|---|
| Florida | 153,321 | 656.0 | $54,919 | $90,582 | $13,371,709,216 |
| Texas | 119,991 | 383.5 | $55,416 | $77,241 | $9,042,399,283 |
| Louisiana | 59,681 | 1,298.1 | $52,489 | $62,023 | $3,649,419,741 |
| North Carolina | 28,055 | 254.0 | $15,521 | $43,276 | $1,101,458,812 |
| South Carolina | 17,053 | 311.3 | $14,363 | $31,462 | $518,926,241 |
| New Jersey | 11,943 | 125.7 | $17,208 | $38,716 | $417,153,136 |
| New York | 9,521 | 47.9 | $15,433 | $33,760 | $294,800,117 |
| Pennsylvania | 7,140 | 54.6 | $13,950 | $35,445 | $229,778,789 |
| Missouri | 6,360 | 101.8 | $20,972 | $45,827 | $262,333,277 |
| Kentucky | 5,872 | 128.0 | $18,224 | $39,843 | $210,049,782 |
| Georgia | 5,803 | 51.9 | $14,633 | $31,302 | $172,962,724 |
| California | 4,985 | 12.6 | $20,451 | $46,285 | $216,631,746 |
| Virginia | 4,855 | 55.1 | $13,023 | $26,889 | $122,355,554 |
| Alabama | 4,703 | 91.2 | $13,276 | $34,161 | $156,794,765 |
| Mississippi | 4,621 | 157.0 | $14,088 | $28,940 | $125,404,164 |
| Illinois | 4,479 | 35.2 | $9,730 | $21,762 | $85,798,526 |
| Tennessee | 3,372 | 46.7 | $18,458 | $41,054 | $123,841,656 |
| Massachusetts | 3,167 | 44.4 | $13,198 | $29,940 | $84,471,560 |
| Michigan | 2,729 | 26.9 | $12,859 | $30,410 | $74,744,085 |
| West Virginia | 2,707 | 152.9 | $16,516 | $35,506 | $82,607,051 |
| Washington | 2,656 | 33.4 | $20,656 | $43,558 | $111,382,697 |
| Ohio | 2,625 | 22.1 | $10,903 | $25,338 | $60,539,918 |
| Arkansas | 2,230 | 72.2 | $27,506 | $44,940 | $92,598,350 |
| Maryland | 2,202 | 35.2 | $10,180 | $25,828 | $52,587,340 |
| Indiana | 2,180 | 31.5 | $13,983 | $31,951 | $60,332,464 |
| Iowa | 1,833 | 56.5 | $14,693 | $38,954 | $62,972,281 |
| Wisconsin | 1,814 | 30.4 | $15,345 | $33,423 | $55,332,581 |
| Oklahoma | 1,783 | 43.5 | $27,960 | $47,346 | $80,547,697 |
| Connecticut | 1,600 | 43.5 | $14,438 | $32,047 | $46,024,449 |
| Nebraska | 1,418 | 70.7 | $15,164 | $38,119 | $50,977,105 |
| Hawaii | 1,196 | 82.7 | $29,819 | $62,991 | $74,170,324 |
| Maine | 1,070 | 76.2 | $22,503 | $41,744 | $41,084,181 |
| Vermont | 929 | 143.3 | $22,987 | $58,083 | $48,029,263 |
| Kansas | 883 | 29.7 | $13,323 | $31,173 | $25,381,599 |
| Puerto Rico | 724 | 22.6 | $26,526 | $41,071 | $27,608,607 |
| Minnesota | 586 | 10.1 | $10,475 | $26,112 | $14,459,214 |
| New Hampshire | 584 | 41.4 | $16,681 | $34,277 | $17,535,322 |
| Oregon | 554 | 13.0 | $13,204 | $31,001 | $16,388,155 |
| South Dakota | 500 | 54.1 | $17,592 | $42,936 | $19,467,575 |
| Arizona | 484 | 6.4 | $15,579 | $32,246 | $15,007,790 |
| Delaware | 473 | 45.0 | $6,693 | $27,089 | $12,185,762 |
| New Mexico | 445 | 20.9 | $25,929 | $60,366 | $25,209,752 |
| Colorado | 437 | 7.3 | $5,536 | $14,559 | $5,782,633 |
| Rhode Island | 402 | 36.1 | $12,238 | $49,925 | $16,592,286 |
| Idaho | 253 | 12.6 | $11,704 | $19,227 | $4,612,633 |
| Montana | 224 | 19.7 | $10,478 | $34,750 | $7,362,287 |
| Nevada | 199 | 6.1 | $11,212 | $32,677 | $6,246,068 |
| District of Columbia | 147 | 20.9 | $4,480 | $15,250 | $1,838,457 |
| North Dakota | 136 | 17.1 | $4,932 | $8,949 | $1,063,004 |
| Alaska | 129 | 17.4 | $21,747 | $48,830 | $6,264,059 |
| Utah | 113 | 3.2 | $7,018 | $18,864 | $1,985,719 |
| Wyoming | 68 | 11.6 | $6,758 | $19,049 | $1,245,714 |
Data quality and the cleaning applied
Two fields in this dataset need treatment before anything is computed from them, and the same treatment is applied in our depth report so the two agree.
| Issue | Claims affected | How we handled it |
|---|---|---|
| Building damage below $1,000 | 135,651 | Excluded, together with claims carrying no damage amount and claims outside the 50 states, the District of Columbia and Puerto Rico. Very low damage values behave like placeholders rather than assessments. |
| Water depth recorded as exactly 99 | 13,551 | Excluded from the depth column. This is a sentinel value, not a measurement. |
| Negative water depth | 17,085 | Excluded from the depth column. The dataset uses negative values for water below the first floor. |
| Water depth above 20 feet | 30,953 | Excluded from the depth column. Depths at that level are not plausible at this frequency, and the field runs to several hundred feet. |
| No water depth recorded | 76,981 | Excluded from the depth column only, retained for all counts and damage figures. |
Method
How we counted. We retrieved 626,886 NFIP redacted claim records with a loss year of 2015 or later from the FEMA OpenFEMA API on 4 October 2026. We kept claims whose state code resolves to one of the 50 states, the District of Columbia or Puerto Rico and whose building damage amount is at least $1,000, leaving 491,235 claims. For each state we computed the claim count, the median and mean building damage amount, and the sum of amounts paid on building claims. Claims per 100,000 residents uses 2025 Census population estimates as the denominator. State medians are ranked only where a state has at least 300 qualifying claims, and the claims-per-declaration ratio only where a state also has at least 50 county-level declarations between 2015 and 2025. Medians are reported in preference to means because the damage distribution is right skewed. No inflation adjustment is applied, so all currency figures are nominal.
Reproduce this
Reproduce this
- Endpoint
https://www.fema.gov/api/open/v3/NfipClaims- Query
$filter=yearOfLoss ge 2015- Rows retrieved
- 626,886 rows
- Retrieved
- 4 October 2026
The API pages at 5,000 rows via $top and $skip. No API key is required. Declaration counts come from the FEMA Disaster Declarations Summaries dataset on the same API. Re-running either query will return a larger set as newer records are added.
What this does not show
What this does not show
- These are insured flood losses only. NFIP covers policyholders. Uninsured flood damage is absent, and so is every water loss that is not a flood, including burst pipes, appliance failures and sewer backups outside a flood event. A state with low flood insurance take-up will look safer here than it is.
- Damage amount is not restoration cost. The field records assessed damage on the claim, which is not what a contractor billed or what the work cost.
- Claim counts track policies as well as weather. A state with more NFIP policies in force will file more claims from the same storm. We do not hold policy counts, so the per-capita figure normalises for population and not for insurance penetration.
- No inflation adjustment. Figures spanning 2015 to 2026 are nominal dollars, so the later years carry more weight in every total than a real-terms series would give them.
- 2025 and 2026 are incomplete. Claims are filed and settled after the loss, so the most recent loss years undercount and will keep growing.
- Declarations and claims are not comparable units. The ratio in this report is an index, not a rate. Declarations are county-level events across all hazards; claims are insured flood losses at property level.
Most quotable figures
- Florida, Texas and Louisiana account for 67.8% of all NFIP building claims filed since 2015 (FEMA OpenFEMA, n = 491,235).
- Per 100,000 residents, Louisiana records 1,298 NFIP claims since 2015 against 656 for Florida (FEMA OpenFEMA and US Census Bureau).
- State median building damage per NFIP claim ranges 10.0 times, from $5,536 in Colorado to $55,416 in Texas (FEMA OpenFEMA, 2015 to 2026).
- Puerto Rico records only 1.0 NFIP claims per county disaster declaration since 2015, against 137.3 in New Jersey, which points to uninsured exposure or a non-flood loss mix (FEMA data).
Questions this report answers
Which state has the most flood claims?
Florida, with 153,321 NFIP building claims carrying a loss year of 2015 or later, which is 31.2% of the national total in this sample from FEMA data.
Which state has the most flood claims per person?
Louisiana, at 1,298 NFIP claims per 100,000 residents since 2015, using 2025 Census population estimates. The raw-count leader, Florida, records 656 on the same measure.
Why do the two rankings differ?
Raw counts reward population and policy volume. A large state will file more claims than a small one from comparable weather. Dividing by population isolates how concentrated the exposure is among the people who live there, which is the more useful number for siting capacity or crews.
What is the average flood claim in my state?
The full state table above gives the median and the mean building damage amount for every state with a qualifying claim. The national median is $36,429 per claim across 491,235 claims in FEMA data. Use the median: the mean is pulled upward by a small number of very large losses.
Why does median damage differ so much between states?
Recorded water depth, building stock and flood type all vary by geography. Median damage runs from $5,536 to $55,416 across ranked states in FEMA data. Depth is the factor this dataset lets us check, and the high-median states also record deeper water.
Does a federal disaster declaration mean a flood claim?
No. Declarations are county-level and cover every hazard, including severe storms, tornadoes, wildfire and winter weather. A claim requires a flood and a policy. Where a state has many declarations and few claims, the likely reading is low flood insurance take-up or a loss mix that is not flood.
Can I reuse this data?
Yes. The tables and derived figures are released under CC BY 4.0 with attribution to Remediation Insider. The underlying claims and declaration data are public and available from FEMA, and the population denominators from the US Census Bureau.
How to cite
Remediation Insider. Flood Claims by State: Where Water Losses Concentrate. https://remediationinsider.com/flood-claims-by-state/ (retrieved 4 October 2026).
Data and tables in this report are released under CC BY 4.0. Attribution: Remediation Insider.
Sources
- Federal Emergency Management Agency. FEMA OpenFEMA NFIP Redacted Claims, v3. Claims with loss year 2015 or later. 626,886 records retrieved 4 October 2026.
- FEMA OpenFEMA Disaster Declarations Summaries. County-level declaration records for 2015 to 2025, retrieved 4 October 2026.
- US Census Bureau Vintage 2025 population estimates. 2025 state resident population, used as the denominator for every per-capita figure in this report.
- FEMA OpenFEMA Terms and Conditions.
- No survey, interview or physical inspection was conducted for this report. Every figure is computed from the retrieved data files.
This product uses the Federal Emergency Management Agency’s OpenFEMA API, but is not endorsed by FEMA. The Federal Government or FEMA cannot vouch for the data or analyses derived from these data after the data have been retrieved from the Agency’s website(s).