The short answer
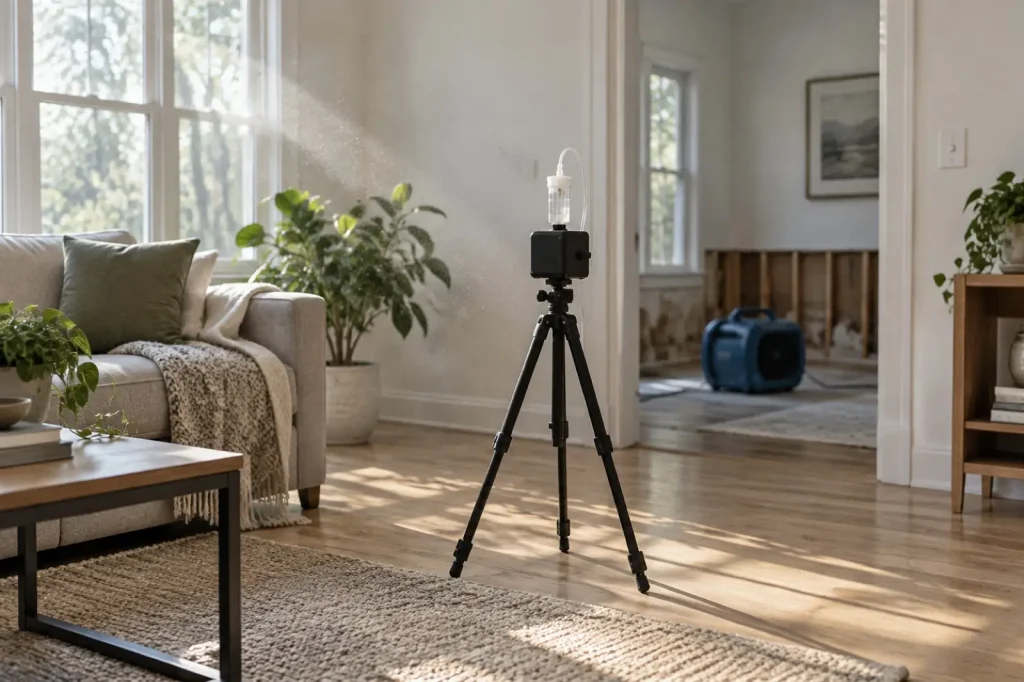
Mold spores in air are normal: EPA and CDC both say mold is present indoors and outdoors, and no federal agency sets an airborne limit. According to a 2002 survey of 1,717 US buildings, median outdoor air held about 540 culturable fungi per cubic metre and indoor air about 82. A count is judged against same-day outdoor air and by the types present, not against a fixed number.
Key takeaways
- There is no federal limit. EPA says no EPA or other federal limits exist for mold or spores, and CDC says there are no set standards for an acceptable quantity in a home.
- Indoor air usually holds fewer spores than outdoor air. Per the Shelton and colleagues (2002) survey of 1,717 buildings, the indoor to outdoor ratio was 1 or lower in 85% of them.
- Season moves the baseline. Outdoor Cladosporium medians in fall were 3.1 times the winter figure in the same survey.
- The same four groups dominate indoors and out: Cladosporium, Penicillium, nonsporulating fungi and Aspergillus.
- After remediation, EPA says indoor kinds and concentrations should be similar to outdoor air; it does not set a number.
- HEPA is rated at 0.3 microns, and EPA puts spores at 2 to 100 microns, so filtration works once the source is gone.
On this page
The useful question is not whether a building has airborne mold spores. It does. The question is whether the indoor count and mix look like the outdoor air feeding it. This page sets out the published baseline data, the comparison method and the levers that move a count.
Airborne mold spores are always present
EPA's brief guide to mold says spores are invisible to the naked eye, float through outdoor and indoor air, and cannot all be removed from a home. The EPA mold course, chapter 1 gives their size as 2 to 100 microns and says the number in indoor and outdoor air fluctuates from season to season, day to day and even hour to hour. CDC mold basics lists the ways outdoor spores get in: open doorways, windows, vents, and heating and air conditioning systems, plus clothing, shoes and pets.
What a normal mold spore count looks like
Shelton and colleagues (2002) report 12,026 culturable air samples from 1,717 US buildings, taken with an Andersen N6 sampler during indoor air quality investigations from 1996 to 1998, and describe it as the largest such study to date. It reports a median of about 540 colony-forming units per cubic metre (CFU/m³) outdoors and 82 indoors, a gap of 6.6 times.
| Percentile | Outdoor CFU/m³ | Indoor CFU/m³ | Indoor to outdoor ratio |
|---|---|---|---|
| 25th | 200 | 24 | 0.049 |
| Median | 540 | 82 | 0.16 |
| 75th | 1,200 | 240 | 0.45 |
| 95th | 3,200 | 1,300 | 2.8 |
Two cautions. These buildings were under investigation, not a random sample, and the data are almost three decades old. And culture counts only what grows on the plate, so the numbers are not comparable with a spore trap count, which tallies spores on a slide. Outdoor spore trap counts are what the AAAAI National Allergy Bureau publishes, in spores per cubic metre from a volumetric sampler. Its severity bands look like this:
| NAB mold band | Spores per m³ |
|---|---|
| Low | Below 6,500 |
| Moderate | 6,500 to 13,000 |
| High | 13,000 to 50,000 |
| Very high | 50,000 and above |
Seasons and genera move the baseline
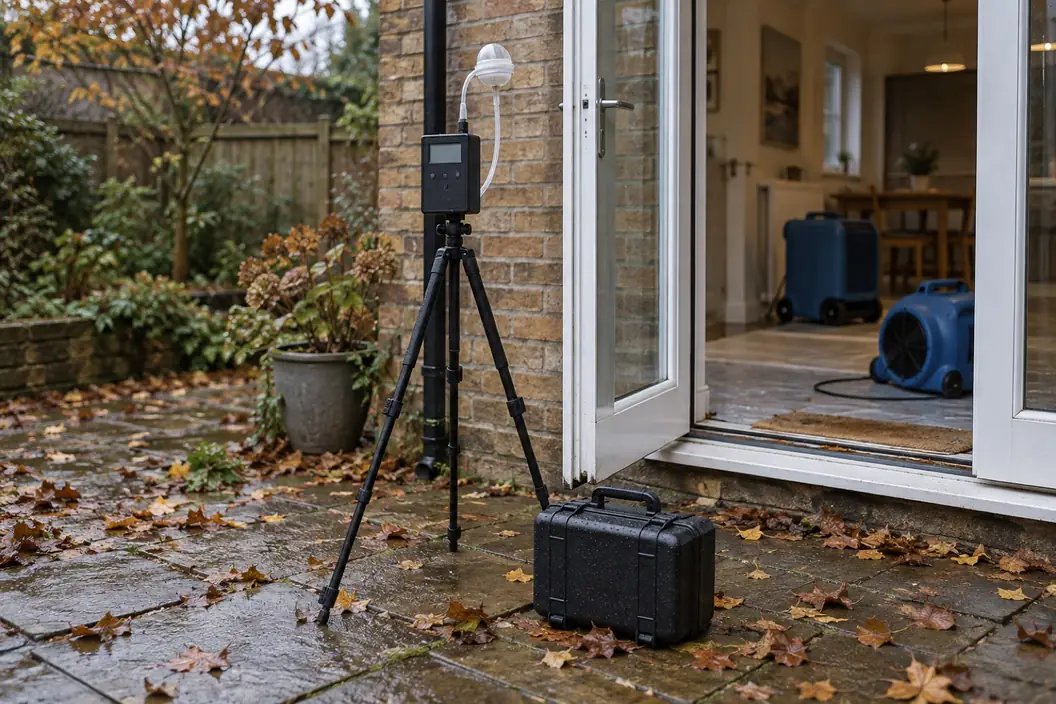
Shelton and colleagues (2002) report that outdoor levels were highest in fall and summer and lowest in winter and spring, and highest in the Southwest, Far West and Southeast. Indoor levels followed the same pattern, and indoor and outdoor concentrations were correlated (Spearman 0.43). Cladosporium, one of the two types found most often outdoors, shows the swing clearly.
The mix matters as much as the total. According to the study, the same four groups led indoors and outdoors in every season and region, while Stachybotrys chartarum turned up in the indoor air of 6% of buildings and the outdoor air of 1%. Why that genus gets attention is covered in black mold versus regular mold.
How indoor counts are compared with outdoor counts
A spore report is read as a comparison, never as a pass mark. The comparison needs at least three samples taken the same way: outdoors, in the room of concern, and in a room away from it. Then work down the checklist with the lab report in hand.
| Check | Question | What it tells you | Basis |
|---|---|---|---|
| 1 | Outdoor control taken the same day, same sampler, same duration? | If not, the indoor number has no baseline | EPA lists omitted outdoor controls as a common sampling problem |
| 2 | Indoor total at or below outdoor? | Typical of most buildings | Ratio 1 or lower in 85% of buildings, per the Shelton survey |
| 3 | Indoor well above outdoor? | Ratio above 2.8 put a building in the top 5% of the survey | Per the Shelton survey, Table 1 |
| 4 | Same types indoors as outdoors? | Different dominant types suggest an indoor source | EPA: after cleanup, kinds should be similar |
| 5 | Types rare outdoors present indoors? | Stachybotrys was outdoors in 1% of buildings | Per the Shelton abstract |
| 6 | Conditions during sampling recorded? | Pressure, temperature, activity and humidity shift counts | EPA mold course, chapter 7 |
The EPA mold course, chapter 3 warns that air sampling describes only the moment it was taken, that inadequate sample plans produce misleading results, and that experience in interpretation is essential. A single high reading on a dry day after vacuuming is not the same finding as repeat high readings with an indoor-only type. Choosing the test itself is covered in mold testing.
Why there are no federal exposure limits
The EPA mold testing page says no EPA or other federal limits have been set for mold or mold spores, so sampling cannot check compliance with any federal standard. CDC says there are no set standards for what is an acceptable quantity of mold in a home and does not recommend testing (CDC mold basics). The OSHA mold page says mold is found indoors and outdoors all year, and the OSHA indoor air page says OSHA has no indoor air quality standards.
The data above show why. Outdoor baselines swing by season, region and hour, and culture and spore trap methods count different things, so a single national number could not fit that spread. Where a number appears on a report, ask whose it is. The wider pollutant panel is covered in indoor air quality testing.
What raises indoor counts
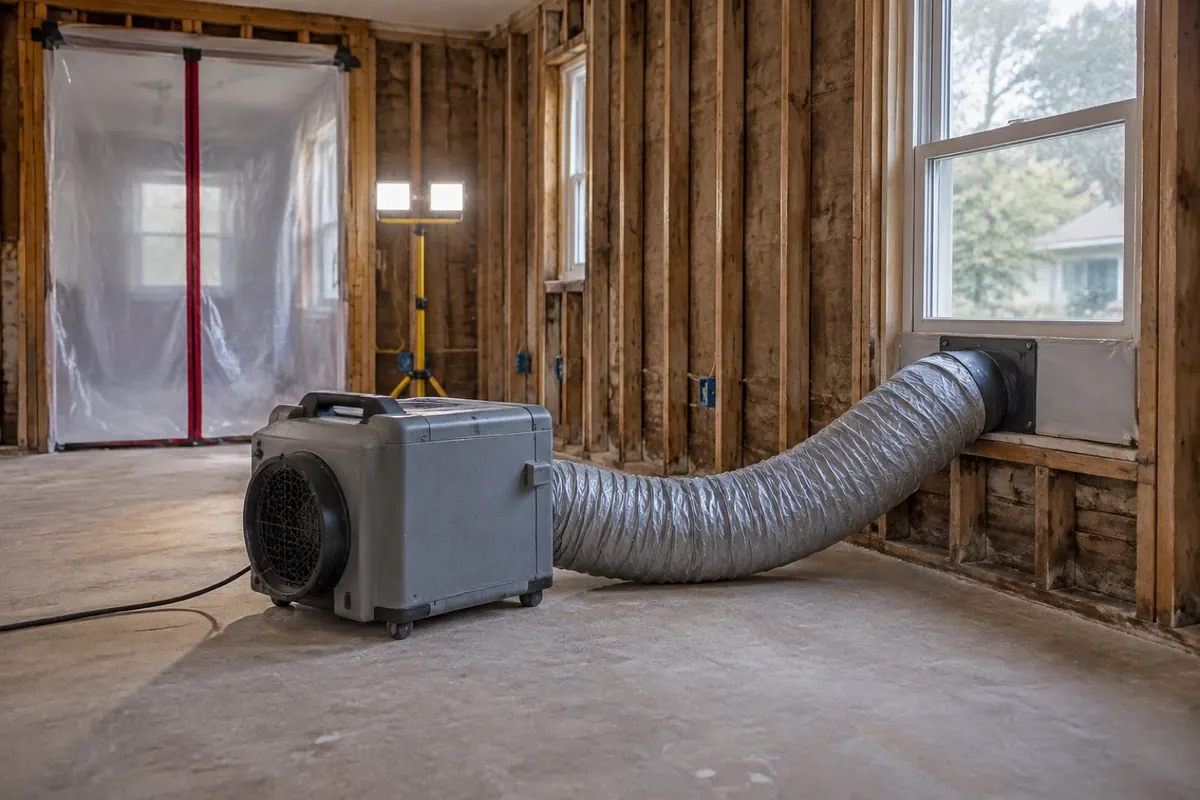
Five things push an indoor count up, and two of them, outdoor air and conditions on the day, say nothing about the building. Sorting them out is the point of the outdoor control.
| Driver | Mechanism | Source |
|---|---|---|
| Outdoor air coming in | Doors, windows, vents, HVAC, clothing, shoes, pets | CDC mold basics |
| Active growth | Wet materials not dried within 24 to 48 hours; humidity above 60% | EPA's brief guide to mold |
| Disturbance | Opening or demolishing moldy areas spreads spores | EPA mold course, chapter 3 |
| Contaminated HVAC | EPA says do not run a system known or suspected to be contaminated | EPA schools remediation guide |
| Conditions at sampling | Barometric pressure, temperature, activity, humidity | EPA mold course, chapter 7 |
Growth needs moisture, which is why EPA’s advice is to dry water-damaged items within 24 to 48 hours; how fast growth starts is covered in how long mold takes to grow after water damage.
How HEPA filtration and air changes reduce airborne spores
Filtration removes spores from the air; it does not stop a source. The EPA HEPA page says a HEPA filter, as defined by the US Department of Energy, can theoretically remove at least 99.97% of particles at 0.3 microns, the hardest size to catch. Spores at 2 to 100 microns, per the EPA mold course, sit well above that size.
How fast the air clears depends on air changes per hour (ACH). According to CDC Table B.1, the time to remove 99% and 99.9% of an airborne contaminant at each rate is as below, assuming perfect mixing and no ongoing source.
| Air changes per hour | Minutes to 99% removal | Minutes to 99.9% removal |
|---|---|---|
| 2 | 138 | 207 |
| 4 | 69 | 104 |
| 6 | 46 | 69 |
| 12 | 23 | 35 |
The no-source condition is the catch. While wet drywall is still growing mold, or while a crew is tearing it out, the count is being refilled. Sizing a machine to a room is covered in what is an air scrubber.
Clearance sampling after remediation
EPA gives the clearance test in words, not numbers. The EPA schools remediation guide lists the criteria below and calls the decision a judgment call. The EPA mold course, chapter 7 adds that sampling is usually not necessary to judge remediation and that a negative sampling report must not replace a visual survey.
| Criterion | What EPA asks for | Note |
|---|---|---|
| Moisture problem fixed | Completely fixed | Required first |
| Mold removal complete | No visible mold, damaged materials or odours | Professional judgment |
| Air sampling, if done | Kinds and concentrations similar to outside | No numeric target |
| Revisit | No new water damage or growth | Shortly after the work |
| Occupancy | Occupied without complaints | Final check |
The industry standard is ANSI/IICRC S520, now in its 2024 fourth edition, which includes post-remediation verification. The ANSI/IICRC S500 definition quoted in an IICRC S500 statement gives the indoor environmental professional the job of verifying the return to a normal microbial ecology (Condition 1). The sequence around it is in our mold remediation process guide.
For contractors: sampling, scope and the line item
Air results drive scope only when the plan is sound. Before work starts, the file should show the outdoor control, matching sampler and duration, the conditions on the day and a lab accredited under the AIHA EMLAP programme (AIHA Laboratory Accreditation Programs). Keep the assessor separate from the firm doing the work. After the work, clearance repeats the same method and locations.
| Method | What it counts | EMSL 2026 lab fee per sample | Limit |
|---|---|---|---|
| Spore trap (non-culturable) | Total spores on a slide, by type | $68 (2 week) to $328 (3 hour) | Counts spores whether or not they would grow; 3-hour rush rate |
| Culturable air sample | Colonies that grow, by genus or species | $113 genus, $184 species (2 week) | Counts only what grows; 2-week rate only |
| Surface sample | Settled spores or growth on a material | Varies by method | EPA: can show if cleaning worked |
HomeAdvisor reports mold testing at $300 to $1,000 as a service; our mold inspection cost guide breaks that down. More on the trade sits in the mold hub.
What this page does not cover. It explains spore counts and how they are compared, not health effects; for those, see CDC’s mold pages and talk to a physician.
Questions people actually ask
Is it normal to have mold spores in the air?
Yes. EPA says spores float through outdoor and indoor air and cannot all be removed from a home, and CDC says mold is found both indoors and outdoors. What matters is whether the indoor count and mix resemble outdoor air.
What is a normal mold spore count?
There is no official normal. The 2002 Shelton survey found a median of about 540 culturable fungi per cubic metre outdoors and 82 indoors, with indoor at or below outdoor in 85 percent of buildings. Spore trap counts measure something different, all spores on a slide, so compare like with like.
How do you kill mold spores in the air?
You remove them rather than kill them. Fix the moisture, remove the growth, then filter: EPA says HEPA filters capture at least 99.97 percent of particles at 0.3 microns, and spores are larger. Air changes speed it up. Killing airborne spores does not stop a wet wall from releasing more.
Will I be okay if I inhaled mold spores?
Everyone breathes airborne spores daily, because they are always in outdoor air. Whether a particular exposure matters for a particular person is a medical question for a physician, and CDC’s mold pages are the federal reference. This page covers how counts are measured and compared.
Do air purifiers remove mold spores?
A HEPA unit captures airborne spores, and CDC’s air-change table shows how quickly a room clears with no ongoing source. It does not fix the growth producing them. Sized units used on job sites are covered on our air scrubber page.
Who offers water damage restoration with mold removal and air quality testing?
Many restoration firms offer all three. The air testing is best done by an assessor independent of the remediation, using an outdoor control and an AIHA-accredited lab, so the clearance result is not graded by the firm being paid for the work. We do not rank or recommend companies.
Where can I see outdoor mold spore counts today?
The AAAAI National Allergy Bureau publishes outdoor pollen and mold spore counts from stations staffed mainly by volunteers, in spores per cubic metre, banded from low to very high. Its FAQ says a collector represents roughly 50 miles around it: a regional baseline, not a substitute for an outdoor control at the building.
Sources
- Shelton and colleagues (2002): Shelton BG, Kirkland KH, Flanders WD, Morris GK. Profiles of airborne fungi in buildings and outdoor environments in the United States. Appl Environ Microbiol 2002;68(4):1743 to 1753. Retrieved 18 October 2026.
- AAAAI National Allergy Bureau, AAAAI: station severity bands and NAB FAQ. Retrieved 18 October 2026.
- EPA's brief guide to mold and EPA mold testing page, EPA. Retrieved 18 October 2026.
- EPA mold course, chapter 1, EPA mold course, chapter 3 and EPA mold course, chapter 7, EPA. Retrieved 18 October 2026.
- EPA schools remediation guide, EPA. Retrieved 18 October 2026.
- EPA HEPA page, EPA. Retrieved 18 October 2026.
- CDC mold basics, CDC. Retrieved 18 October 2026.
- CDC Table B.1, CDC infection control guidelines. Retrieved 18 October 2026.
- OSHA mold page, OSHA indoor air page and OSHA Technical Manual IAQ chapter, OSHA. Retrieved 18 October 2026.
- ANSI/IICRC S520 page and IICRC S500 statement, 10 February 2026. Retrieved 18 October 2026.
- EMSL 2026 price list, EMSL Analytical, Inc. Retrieved 18 October 2026.
- AIHA Laboratory Accreditation Programs. Retrieved 18 October 2026.
- HomeAdvisor, cost guide updated 19 June 2026. Retrieved 18 October 2026.
- Ratios are our arithmetic on the published figures. See our methodology.
Confirm current editions and prices with each publisher.