The finding
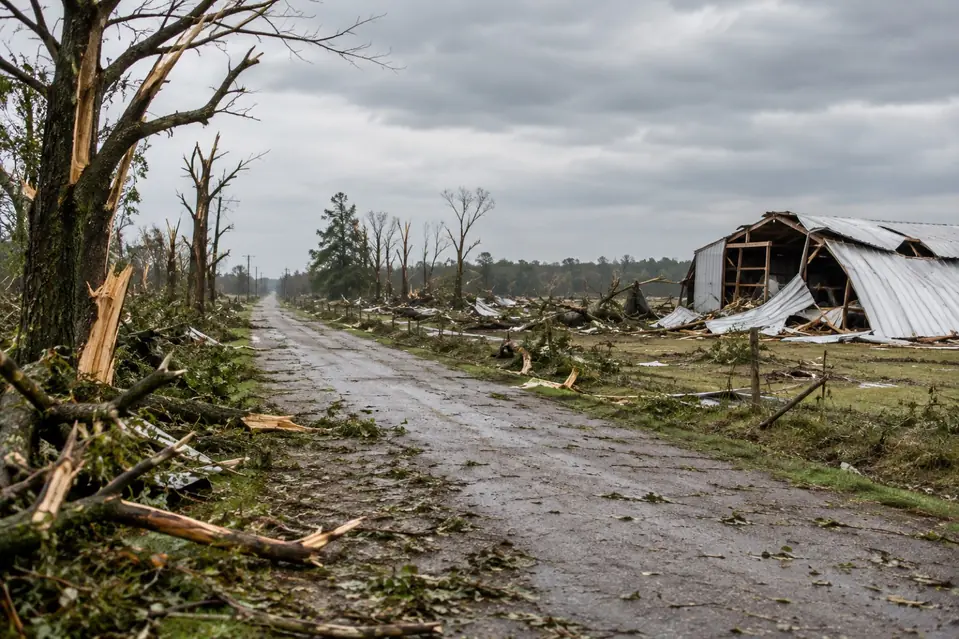
Ranked as tornado damage by state, Texas leads NOAA’s Storm Events records for 2015 to 2025 with $2.34 billion of reported property damage, 18% of the $13.3 billion national total, followed by Missouri at $1.94 billion. Per resident, Missouri ranks first at $310 (NOAA, Census). The dollar ranking and the human toll diverge: Kentucky recorded the most tornado deaths (98) yet ranks 20th for damage, and 31% of its county records carry no damage estimate at all (NOAA).
Headline figures
In this report
- Counting tornadoes, not rows
- The state ranking by reported damage
- Per resident: a different top ten
- Where the dollars are missing
- Strength: the EF scale and the losses
- The counties behind the totals
- Outbreak days
- Spring peak, Southern winter
- After dark
- Year by year
- What the records say for restoration work
- Data treatment
- Method
- Reproduce this
- What this does not show
- Questions this report answers
- Sources
Key findings
- Texas leads with $2.34 billion of reported tornado property damage from 2015 to 2025, and also logged the most tornadoes, 1,363 (NOAA).
- Per resident, Missouri tops the ranking at $310 of reported damage per 2025 resident, ahead of Tennessee ($263) and Arkansas ($241); Texas ranks 8th (NOAA, Census).
- Kentucky recorded 98 of the 563 tornado deaths, more than any other state, but 31% of its county records have no damage estimate, so its $65.6 million total is a floor, not a measure of loss (NOAA).
- The deadliest single tornado in the file, an EF4 on the ground for 169 miles across Kentucky and Tennessee in December 2021, is linked to 58 deaths yet carries $25,000 of reported damage: 12 of its 14 county segments have no estimate (NOAA).
- EF3 and stronger tornadoes are 2.1% of the 14,271 tornadoes but carry 77% of deaths and 63% of reported damage (NOAA).
- The 10 costliest tornadoes hold 54% of the $13.3 billion reported, and the single costliest (Illinois and Missouri, May 2025) holds 12% (NOAA).
- In Mississippi, 37% of tornadoes fall between November and February, against 16% nationally (NOAA).
- Tornadoes that began between 18:00 and 06:00 local time are 42% of the count but 65% of deaths (NOAA).
Counting tornadoes, not rows
The Storm Events files hold 16,489 Tornado rows for 2015 to 2025, but that is not the number of tornadoes. Each row is one tornado in one county. When a tornado crosses a county line, the row for the county it leaves names the next county in the TOR_OTHER_CZ fields, and the next county gets a row of its own (NCEI Storm Data bulk CSV format documentation). Chaining those links gives 14,271 tornadoes (NOAA). Of them, 1,789 crossed at least one county line and 210 crossed a state line; the longest chain runs through 14 counties (NOAA). Source: NOAA NCEI Storm Events.
This report uses each unit for what it measures. Dollars, deaths and county rankings are summed over rows, because each row carries its own figures and nothing is entered twice. Counts, EF ratings, path lengths and seasonality use tornadoes. A tornado that crosses a state line is counted once in each state it touched, so state counts add up to more than the national 14,271. Of 2,251 links, 20 found no partner row and are left as separate tornadoes (NOAA). Source: NOAA NCEI Storm Events.
The state ranking by reported damage
The 12 states with the most reported tornado property damage hold 89% of the 50-state and DC total of $13.3 billion for 2015 to 2025 (NOAA). Texas leads on dollars and on tornado count. Oklahoma, second by count with 940 tornadoes, ranks 9th on dollars. Source: NOAA NCEI Storm Events.
| State | Tornadoes | County records | Reported damage | Records with no estimate | Median positive estimate | Damage per resident | Deaths |
|---|---|---|---|---|---|---|---|
| Texas | 1,363 | 1,502 | $2.34 billion | 17% | $75,000 | $75 | 49 |
| Missouri | 548 | 647 | $1.94 billion | 15% | $75,000 | $310 | 31 |
| Tennessee | 327 | 421 | $1.90 billion | 11% | $50,000 | $263 | 63 |
| Florida | 555 | 588 | $1.01 billion | 17% | $50,000 | $43 | 12 |
| Arkansas | 403 | 466 | $744.9 million | 10% | $60,000 | $241 | 15 |
| Ohio | 376 | 429 | $662.2 million | 5% | $50,000 | $56 | 5 |
| Louisiana | 625 | 712 | $635.8 million | 9% | $50,000 | $138 | 23 |
| Iowa | 703 | 831 | $632.2 million | 15% | $50,000 | $195 | 15 |
| Oklahoma | 940 | 1,077 | $619.6 million | 2% | $30,000 | $151 | 23 |
| Mississippi | 865 | 1,097 | $562.0 million | 5% | $40,000 | $191 | 68 |
| North Carolina | 304 | 339 | $445.1 million | 16% | $50,000 | $40 | 9 |
| Georgia | 522 | 637 | $389.2 million | 27% | $50,000 | $35 | 37 |
| Illinois | 820 | 958 | $249.4 million | 5% | $50,000 | $20 | 15 |
| Michigan | 151 | 163 | $234.4 million | 15% | $100,000 | $23 | 5 |
| South Carolina | 284 | 320 | $127.1 million | 55% | $50,000 | $23 | 9 |
| Indiana | 355 | 405 | $124.1 million | 11% | $50,000 | $18 | 8 |
| Virginia | 158 | 182 | $113.0 million | 9% | $50,000 | $13 | 5 |
| Kansas | 674 | 734 | $107.5 million | 25% | $60,000 | $36 | 0 |
| Wisconsin | 313 | 351 | $82.7 million | 12% | $79,500 | $14 | 1 |
| Kentucky | 338 | 414 | $65.6 million | 31% | $60,000 | $14 | 98 |
| Alabama | 733 | 896 | $49.7 million | 26% | $53,300 | $10 | 57 |
| Maryland | 73 | 82 | $49.4 million | 23% | $240,000 | $8 | 2 |
| Minnesota | 530 | 591 | $46.0 million | 24% | $95,000 | $8 | 1 |
| Pennsylvania | 244 | 265 | $45.6 million | 20% | $25,000 | $3 | 1 |
| Nebraska | 469 | 513 | $42.9 million | 34% | $100,000 | $21 | 0 |
| South Dakota | 225 | 228 | $21.2 million | 50% | $80,000 | $23 | 1 |
| California | 72 | 73 | $20.7 million | 22% | $20,000 | $1 | 0 |
| North Dakota | 282 | 298 | $17.1 million | 47% | $150,000 | $22 | 4 |
| New York | 112 | 114 | $12.0 million | 31% | $37,000 | $1 | 5 |
| Massachusetts | 38 | 39 | $11.9 million | 5% | $10,000 | $2 | 0 |
| New Jersey | 47 | 55 | $5.5 million | 69% | $117,000 | $1 | 0 |
| New Mexico | 121 | 122 | $5.2 million | 15% | $100,000 | $2 | 0 |
| West Virginia | 43 | 45 | $3.9 million | 4% | $50,000 | $2 | 0 |
| Colorado | 456 | 471 | $3.0 million | 19% | $31,250 | $0 | 0 |
| Utah | 21 | 21 | $2.3 million | 0% | $1,150,000 | $1 | 0 |
| Washington | 24 | 24 | $1.8 million | 4% | $40,000 | $0 | 0 |
| Oregon | 29 | 29 | $1.6 million | 7% | $25,000 | $0 | 0 |
| Montana | 41 | 41 | $1.6 million | 15% | $50,000 | $1 | 0 |
| Rhode Island | 9 | 9 | $1.4 million | 0% | $30,000 | $1 | 0 |
| Connecticut | 31 | 31 | $1.3 million | 26% | $30,000 | $0 | 0 |
| Arizona | 63 | 63 | $965,000 | 2% | $50,000 | $0 | 0 |
| Wyoming | 107 | 110 | $952,000 | 47% | $20,000 | $2 | 0 |
| Delaware | 16 | 18 | $200,000 | 83% | $200,000 | $0 | 1 |
| District of Columbia | 4 | 4 | $200,000 | 50% | $100,000 | $0 | 0 |
| Vermont | 5 | 5 | $135,000 | 40% | $50,000 | $0 | 0 |
| New Hampshire | 12 | 14 | $94,000 | 43% | $5,000 | $0 | 0 |
| Nevada | 11 | 11 | $20,000 | 27% | $20,000 | $0 | 0 |
| Idaho | 21 | 21 | $14,500 | 24% | $1,000 | $0 | 0 |
| Maine | 10 | 11 | $4,000 | 82% | $2,000 | $0 | 0 |
| Hawaii | 1 | 1 | $0 | 0% | n/a | $0 | 0 |
| Alaska | 1 | 1 | $0 | 0% | n/a | $0 | 0 |
Island areas in the STATE column are kept out of the ranking: Puerto Rico, 9 county records, $197,500 reported damage; Virgin Islands, 1 county record, $0 reported damage. Source: NOAA NCEI Storm Events.
Per resident: a different top ten
Raw totals favour large states. Divided by 2025 population, and limited to states with at least 50 tornadoes, Missouri leads at $310 of reported damage per resident over 11 years, then Tennessee, Arkansas and Iowa (NOAA, Census). North Dakota has the most tornadoes per million residents (354). Sources: NOAA NCEI Storm Events; Census Vintage 2025.
Deaths per million residents give another order. Among states with at least 10 tornado deaths, the rate is highest in Mississippi (23.1) and Kentucky (21.4), against 1.6 in Texas (NOAA, Census).
| State | Deaths | Direct deaths | Deaths per million | Tornadoes | Reported damage |
|---|---|---|---|---|---|
| Mississippi | 68 | 65 | 23.1 | 865 | $562.0 million |
| Kentucky | 98 | 95 | 21.4 | 338 | $65.6 million |
| Alabama | 57 | 57 | 11.1 | 733 | $49.7 million |
| Tennessee | 63 | 63 | 8.7 | 327 | $1.90 billion |
| Oklahoma | 23 | 23 | 5.6 | 940 | $619.6 million |
| Louisiana | 23 | 22 | 5.0 | 625 | $635.8 million |
| Missouri | 31 | 29 | 5.0 | 548 | $1.94 billion |
| Arkansas | 15 | 14 | 4.9 | 403 | $744.9 million |
| Iowa | 15 | 14 | 4.6 | 703 | $632.2 million |
| Georgia | 37 | 32 | 3.3 | 522 | $389.2 million |
| Texas | 49 | 49 | 1.6 | 1,363 | $2.34 billion |
| Illinois | 15 | 15 | 1.2 | 820 | $249.4 million |
| Florida | 12 | 12 | 0.5 | 555 | $1.01 billion |
Where the dollars are missing
NOAA separates a recorded zero from a missing estimate. Of 16,489 Tornado rows, 7,656 (46%) carry a positive damage figure, 5,939 are entered as 0.00K and 2,894 are blank, meaning no estimate was entered (NOAA). The median positive estimate is $50,000 (NOAA). Source: NOAA NCEI Storm Events.
The gaps are not spread evenly. In Kentucky, the state with the most tornado deaths, 31% of county records are blank, and the deadliest tornado in the window shows it most clearly: it began in Obion County, Tennessee, in December 2021, tracked 169 miles, is linked to 58 deaths and 515 injuries, and carries $25,000 of reported damage. 12 of its 14 county segments have no estimate (NOAA). Any ranking by reported dollars gives that tornado almost no weight. Source: NOAA NCEI Storm Events.
| State | County records | Records with no estimate | Reported damage | Deaths |
|---|---|---|---|---|
| New Jersey | 55 | 69% | $5.5 million | 0 |
| South Carolina | 320 | 55% | $127.1 million | 9 |
| South Dakota | 228 | 50% | $21.2 million | 1 |
| Wyoming | 110 | 47% | $952,000 | 0 |
| North Dakota | 298 | 47% | $17.1 million | 4 |
| Nebraska | 513 | 34% | $42.9 million | 0 |
A blank is not a zero. NWS Instruction 10-1605, Storm Data Preparation (26 July 2021) sets out how damage estimates are entered (section 2.7), and the file does not say why one is missing. State totals in this report are therefore floors for reported damage, not measures of total loss. For the largest events valued on a different basis, see the billion-dollar disaster record.
Strength: the EF scale and the losses
Each tornado is rated on the Enhanced Fujita scale from surveyed damage (NOAA Storm Prediction Center, Enhanced Fujita Scale); here a tornado takes the highest rating among its county segments. EF0 and EF1 tornadoes make up 79% of the count and 9% of reported damage (NOAA). EF3 and stronger make up 2.1% of the count, 63% of damage and 77% of deaths (NOAA). The window holds a single EF5 rating: North Dakota, June 2025, with 3 deaths and no damage estimate in the file (NOAA). Source: NOAA NCEI Storm Events.
| Rating | Tornadoes | Share | Deaths | Deaths per tornado | Reported damage | Median positive estimate | Median path (miles) | Median width (yards) |
|---|---|---|---|---|---|---|---|---|
| EF0 | 6,010 | 42.1% | 2 | 0.00 | $155.9 million | $20,000 | 0.9 | 50 |
| EF1 | 5,252 | 36.8% | 31 | 0.01 | $1.01 billion | $75,000 | 3.0 | 150 |
| EF2 | 1,195 | 8.4% | 96 | 0.08 | $3.74 billion | $500,000 | 7.1 | 300 |
| EF3 | 266 | 1.9% | 220 | 0.83 | $7.03 billion | $3,525,000 | 12.7 | 600 |
| EF4 | 32 | 0.2% | 211 | 6.59 | $1.40 billion | $19,775,000 | 35.2 | 1,310 |
| EF5 | 1 | 0.0% | 3 | 3.00 | no estimate | n/a | 19.8 | 1,850 |
| EFU | 1,515 | 10.6% | 0 | 0.00 | $248,000 | $5,000 | 0.5 | 30 |
Path size climbs with rating. The median EF0 track is 0.9 miles long and 50 yards wide; the median EF4 track is 35.2 miles and 1,310 yards (NOAA). The median positive damage estimate rises from $20,000 per EF0 tornado to $19.8 million per EF4 (NOAA). Source: NOAA NCEI Storm Events.
The counties behind the totals
Tornado rows are keyed to counties, so the state totals can be broken down. 2,552 counties and county equivalents in the 50 states and DC recorded at least one tornado from 2015 to 2025 (NOAA). The costliest, Dallas County, Texas, carries $1.99 billion, of which $1.55 billion sits in a single record from October 2019 (NOAA). Source: NOAA NCEI Storm Events.
| County | State | County records | Reported damage | Largest record | Month of largest record | Deaths |
|---|---|---|---|---|---|---|
| Dallas | Texas | 16 | $1.99 billion | $1.55 billion | October 2019 | 10 |
| St. Louis city | Missouri | 1 | $1.60 billion | $1.60 billion | May 2025 | 4 |
| Davidson | Tennessee | 18 | $1.10 billion | $1.09 billion | March 2020 | 5 |
| Montgomery | Ohio | 11 | $502.3 million | $500.0 million | May 2019 | 1 |
| St. Lucie | Florida | 12 | $497.7 million | $475.0 million | October 2024 | 6 |
| Wilson | Tennessee | 17 | $410.6 million | $409.0 million | March 2020 | 3 |
| Craighead | Arkansas | 19 | $308.5 million | $300.0 million | March 2020 | 1 |
| Nash | North Carolina | 5 | $301.8 million | $300.0 million | July 2023 | 0 |
| Dougherty | Georgia | 2 | $300.0 million | $300.0 million | January 2017 | 5 |
| Ouachita | Louisiana | 8 | $251.0 million | $250.0 million | April 2020 | 0 |
| Marshall | Iowa | 7 | $200.0 million | $200.0 million | July 2018 | 0 |
| Leon | Florida | 16 | $185.2 million | $92.1 million | May 2024 | 2 |
The counties logged most often are a different list. Washington County, Colorado, leads with 87 tornado records and $15,000 of reported damage (NOAA). Together the 12 most frequently hit counties report $221.2 million, 1.7% of the national total (NOAA). Frequency does not track loss in this file. The deadliest county is Graves County, Kentucky, with 24 deaths (NOAA). Source: NOAA NCEI Storm Events.
| County | State | Tornado records | EF3 or stronger records | Reported damage | Deaths |
|---|---|---|---|---|---|
| Washington | Colorado | 87 | 0 | $15,000 | 0 |
| Hinds | Mississippi | 46 | 0 | $4.3 million | 0 |
| Rankin | Mississippi | 41 | 0 | $3.6 million | 0 |
| Cleveland | Oklahoma | 39 | 1 | $102.9 million | 0 |
| Mobile | Alabama | 39 | 0 | $75,000 | 0 |
| Palm Beach | Florida | 38 | 1 | $83.1 million | 0 |
| Harris | Texas | 38 | 1 | $23.5 million | 1 |
| Will | Illinois | 37 | 0 | $450,000 | 0 |
| Kit Carson | Colorado | 37 | 0 | $89,500 | 0 |
| Weld | Colorado | 36 | 0 | $530,500 | 0 |
| Grand Forks | North Dakota | 36 | 0 | $35,000 | 0 |
| Leake | Mississippi | 34 | 0 | $2.5 million | 0 |
For the counties FEMA designates most often after disasters of every kind, see the most-declared counties. A Storm Events record needs no federal declaration, and most tornadoes never lead to one.
Outbreak days
Tornado deaths cluster on a few days. The 10 deadliest calendar days in the window hold 47% of the 563 deaths (NOAA). Days are dated by each tornado’s local start time, so a tornado that began after midnight falls on the next date. Source: NOAA NCEI Storm Events.
| Date | States | Tornadoes | EF3 or stronger | Deaths | Reported damage |
|---|---|---|---|---|---|
| 10 December 2021 | Arkansas, Illinois, Missouri and others | 33 | 5 | 74 | $47.5 million |
| 16 May 2025 | Indiana, Missouri, Kentucky and others | 26 | 4 | 25 | $1.66 billion |
| 3 March 2020 | Tennessee, Alabama, Kentucky | 9 | 2 | 24 | $1.60 billion |
| 31 March 2023 | Illinois, Iowa, Indiana and others | 119 | 10 | 24 | $404.5 million |
| 24 March 2023 | Mississippi, Alabama, Tennessee and others | 20 | 3 | 23 | $191.1 million |
| 3 March 2019 | Georgia, Alabama, South Carolina and others | 45 | 2 | 23 | $5.2 million |
| 12 April 2020 | Alabama, Louisiana, Mississippi and others | 70 | 6 | 22 | $338.5 million |
| 11 December 2021 | Tennessee, Kentucky, Georgia and others | 38 | 3 | 18 | $13.2 million |
| 22 January 2017 | Georgia, Alabama, Florida | 22 | 2 | 16 | $314.1 million |
| 12 January 2023 | Alabama, Georgia, Kentucky and others | 42 | 2 | 15 | $540,000 |
Dollars are concentrated too. The 10 costliest tornadoes hold 54% of reported damage (NOAA). The costliest, beginning in St. Louis County, Missouri, in May 2025, carries $1.60 billion; the second, beginning in Dallas County, Texas, in October 2019, carries $1.55 billion. EF ratings shown in the file are as stored. Source: NOAA NCEI Storm Events.
Spring peak, Southern winter
May has the most tornadoes, 3,184 of 14,271, but March has the most deaths (142), and December, with 739 tornadoes, recorded 133 deaths (NOAA). Restoration demand by month across hazards is set out in the restoration seasonality calendar. Source: NOAA NCEI Storm Events.
The calendar differs by state. Nationally, 16% of tornadoes fall between November and February; in Mississippi the share is 37% and in Alabama 37%, while Wyoming sits at 0% (NOAA). Among states with at least 100 tornadoes, the table shows the 6 highest and 3 lowest shares. Source: NOAA NCEI Storm Events.
| State | Tornadoes | November to February | Share | Deaths |
|---|---|---|---|---|
| Mississippi | 865 | 322 | 37% | 68 |
| Alabama | 733 | 272 | 37% | 57 |
| Georgia | 522 | 176 | 34% | 37 |
| Tennessee | 327 | 109 | 33% | 63 |
| Louisiana | 625 | 173 | 28% | 23 |
| Kentucky | 338 | 93 | 28% | 98 |
| North Dakota | 282 | 0 | 0% | 4 |
| Colorado | 456 | 0 | 0% | 0 |
| Wyoming | 107 | 0 | 0% | 0 |
After dark
Begin times in the file are local standard time. Of 14,271 tornadoes, 6,007 (42%) began between 18:00 and 06:00; those tornadoes account for 367 of 563 deaths (65%) and 158 of 299 EF3 or stronger tornadoes (NOAA). The file records when a tornado began, not where people were or whether a warning reached them, so it cannot say why. For safety guidance, see National Weather Service tornado safety. Source: NOAA NCEI Storm Events.
Year by year
Annual tornado counts range from 983 in 2016 to 1,787 in 2024, an average of 1,297 a year (NOAA). 2021 has the most deaths (107); 2016 has the lowest reported damage ($181.2 million). 11 years dominated by single outbreaks are too short to read a trend (NOAA). Source: NOAA NCEI Storm Events.
| Year | County records | Tornadoes | EF3 or stronger | Deaths | Reported damage | Records with no estimate |
|---|---|---|---|---|---|---|
| 2015 | 1,320 | 1,176 | 21 | 36 | $317.9 million | 15% |
| 2016 | 1,081 | 983 | 28 | 18 | $181.2 million | 14% |
| 2017 | 1,663 | 1,446 | 15 | 37 | $633.3 million | 15% |
| 2018 | 1,256 | 1,131 | 12 | 12 | $670.3 million | 16% |
| 2019 | 1,737 | 1,521 | 36 | 44 | $3.09 billion | 14% |
| 2020 | 1,253 | 1,088 | 24 | 77 | $2.50 billion | 18% |
| 2021 | 1,545 | 1,319 | 24 | 107 | $232.6 million | 18% |
| 2022 | 1,384 | 1,169 | 24 | 24 | $698.4 million | 24% |
| 2023 | 1,522 | 1,323 | 31 | 91 | $1.37 billion | 23% |
| 2024 | 2,137 | 1,787 | 46 | 53 | $1.72 billion | 17% |
| 2025 | 1,591 | 1,328 | 38 | 64 | $1.91 billion | 19% |
Partial year, not ranked: the 2026 details file (StormEvents_details-ftp_v1.0_d2026_c20260918.csv.gz) held 990 Tornado records, 854 tornadoes after chaining and 13 deaths at retrieval, with the latest record beginning in June 2026 (NOAA). It is not comparable with the full years above. Source: NOAA NCEI Storm Events.
What the records say for restoration work
For contractors, the volume sits at the low end of the scale. EF0 and EF1 tornadoes are 79% of the count; 62% of EF1 tornadoes carry a positive estimate, with a median of $75,000, and 40% of EF0 tornadoes, with a median of $20,000 (NOAA). The large losses sit higher: the 1,494 tornadoes rated EF2 or stronger, 10% of the count, carry 91% of reported damage (NOAA). Source: NOAA NCEI Storm Events.
Storm Events damage is one figure per county record. It does not split wind and debris damage from water entering through breached roofs and broken windows, or contents from structure, so the share of tornado losses that becomes water damage work cannot be read from this file. For how work volume swings from year to year across hazards, see the restoration demand volatility index; for federal recovery spending by state, FEMA spending by state. Sibling reports cover hurricane damage by state and flash flood deaths by state, and the full set sits on the data hub.
Data treatment
| Rule | Records affected | Treatment |
|---|---|---|
| Blank DAMAGE_PROPERTY (no estimate) | 2,894 | Excluded from damage sums and medians; shown as a share. |
| DAMAGE_PROPERTY entered as 0.00K | 5,939 | Kept as zero in totals; medians use positive estimates only. |
| County links with no partner row | 20 | Left as separate tornadoes. |
| Rows with no begin coordinates | 9 | Linked on time only where a link names them. |
| Island areas in the STATE column | 10 | Reported separately, not ranked. |
| Rows not keyed to a county (CZ_TYPE not C) | 0 | Would be excluded; none occur. |
| Duplicate EVENT_ID | 0 | None found, so no record is counted twice. |
| Rows missing the tornado columns | 0 | Would be treated as unrated; none occur. |
| Partial year 2026 | 990 | Excluded from every ranking; reported in one labelled note. |
Method
How we counted. We downloaded the NOAA NCEI Storm Events details files for 2015 to 2026 on 6 October 2026 and kept rows with EVENT_TYPE Tornado (16,489 rows, 2015 to 2025). Each row is one tornado in one county. We read TOR_F_SCALE, TOR_LENGTH (miles), TOR_WIDTH (yards), the TOR_OTHER_CZ fields and begin and end times and coordinates from the same files. A row naming a next county was chained to the Tornado row in that county beginning within 120 minutes of its end time and within 0.5 degrees of its end point, nearest first, giving 14,271 tornadoes. A tornado’s rating is its highest segment rating; path length sums segments; width is the widest segment. Deaths are DEATHS_DIRECT plus DEATHS_INDIRECT summed over rows. DAMAGE_PROPERTY strings such as 10.00K were converted to dollars; blanks were excluded from sums and medians and zeros kept. Damage is nominal and not inflation adjusted; crop damage is not used. Rankings cover the 50 states and DC; island areas are reported separately. Per resident figures divide 11 years of totals by 2025 population from the Census Bureau Vintage 2025 estimates. Night means a local standard begin time from 18:00 to 05:59. 2026 is a partial year and is excluded from every ranking. Source: NOAA NCEI Storm Events.
Reproduce this
Reproduce this
- Endpoint
https://www.ncei.noaa.gov/pub/data/swdi/stormevents/csvfiles/- Query
StormEvents_details-ftp_v1.0_d{YEAR}_c{STAMP}.csv.gz for 2015 to 2026; keep EVENT_TYPE == 'Tornado'; sum DAMAGE_PROPERTY (K/M/B suffixes, blanks excluded) and DEATHS_DIRECT + DEATHS_INDIRECT by STATE and by STATE_FIPS + CZ_FIPS; chain rows via TOR_OTHER_CZ_STATE + TOR_OTHER_CZ_FIPS to count tornadoes; rate by max TOR_F_SCALE- Rows retrieved
- 16,489 Tornado rows, 2015 to 2025 (14,271 tornadoes after chaining); 990 rows in the partial 2026 file
- Retrieved
- 6 October 2026
Files used, with the NCEI creation stamp (c) in each name: StormEvents_details-ftp_v1.0_d2015_c20260323.csv.gz, StormEvents_details-ftp_v1.0_d2016_c20260323.csv.gz, StormEvents_details-ftp_v1.0_d2017_c20260519.csv.gz, StormEvents_details-ftp_v1.0_d2018_c20260323.csv.gz, StormEvents_details-ftp_v1.0_d2019_c20260323.csv.gz, StormEvents_details-ftp_v1.0_d2020_c20260323.csv.gz, StormEvents_details-ftp_v1.0_d2021_c20260323.csv.gz, StormEvents_details-ftp_v1.0_d2022_c20260625.csv.gz, StormEvents_details-ftp_v1.0_d2023_c20260323.csv.gz, StormEvents_details-ftp_v1.0_d2024_c20260728.csv.gz, StormEvents_details-ftp_v1.0_d2025_c20260819.csv.gz, StormEvents_details-ftp_v1.0_d2026_c20260918.csv.gz. NCEI reissues a year’s file with a new c-stamp when records are corrected, so a later download may differ slightly. Column meanings follow the NCEI Storm Data bulk CSV format documentation; damage entry rules follow NWS Instruction 10-1605, Storm Data Preparation (26 July 2021).
What this does not show
What this does not show
- Reported damage, not total loss. Amounts are NWS estimates from emergency managers, media and other sources, in nominal dollars. A blank means no estimate; state totals are floors.
- Tornado counts are reconstructed. Chaining county segments relies on the TOR_OTHER fields, times and coordinates. A missed or wrong link changes the count by one; official Storm Prediction Center tornado counts may differ slightly.
- Ratings are as stored. EF ratings come from damage surveys, can be revised, and reflect the strongest damage found, not dollars. EFU tornadoes could not be rated.
- Rates are approximate. 11 years of totals divided by one year’s population; no land area adjustment is made.
- No split by cause of loss. The file does not separate wind, debris and water intrusion damage, or say who paid for repairs.
- Not insurance claims or federal aid. Insurer payouts, FEMA grants and SBA loans are different datasets. For decisions, consult FEMA, your state emergency management agency or your insurer.
Most quotable figures
- Texas recorded $2.34 billion of reported tornado property damage from 2015 to 2025, the most of any state (NOAA NCEI).
- Missouri has the highest reported tornado damage per resident, $310 over 2015 to 2025 (NOAA NCEI, Census Vintage 2025).
- Kentucky recorded 98 tornado deaths from 2015 to 2025, the most of any state, yet 31% of its tornado records carry no damage estimate (NOAA NCEI).
- The deadliest tornado in NOAA Storm Events records for 2015 to 2025 is linked to 58 deaths and carries $25,000 in reported property damage (NOAA NCEI).
- EF3 and stronger tornadoes were 2.1% of US tornadoes from 2015 to 2025 but caused 77% of tornado deaths (NOAA NCEI).
- 65% of US tornado deaths from 2015 to 2025 came from tornadoes that began between 18:00 and 06:00 local time (NOAA NCEI).
Questions this report answers
Which state has the most tornado damage?
Texas, with $2.34 billion of reported property damage in NOAA Storm Events records from 2015 to 2025, followed by Missouri at $1.94 billion. Per resident, Missouri ranks first (NOAA NCEI).
Which state has the most tornado deaths?
Kentucky, with 98 deaths from 2015 to 2025, followed by Mississippi with 68 (NOAA NCEI).
How many tornadoes hit the US each year?
An average of 1,297 a year in NOAA records from 2015 to 2025, after joining county segments of the same tornado, ranging from 983 in 2016 to 1,787 in 2024 (NOAA NCEI).
How much tornado damage comes from EF3 or stronger tornadoes?
63% of reported damage and 77% of deaths, from 2.1% of tornadoes, 2015 to 2025 (NOAA NCEI).
Why does Kentucky’s tornado damage look low?
31% of its tornado records have no damage estimate in the file, including most segments of its deadliest tornado, so reported dollars understate the loss (NOAA NCEI).
When is tornado season in the South?
The records show more cool-season tornadoes in the South. In Mississippi, 37% of tornadoes from 2015 to 2025 fell between November and February, against 16% nationally (NOAA NCEI).
How to cite
Remediation Insider. Tornado Damage by State: 14,271 Tornadoes in NOAA Records, 2015 to 2025. https://remediationinsider.com/tornado-damage-by-state/ (retrieved 6 October 2026).
Data and tables in this report are released under CC BY 4.0. Attribution: Remediation Insider.
Sources
- NOAA National Centers for Environmental Information. NOAA NCEI Storm Events Database, bulk details files 2015 to 2026, csvfiles directory. Retrieved 6 October 2026.
- NOAA NCEI. NCEI Storm Data bulk CSV format documentation. Field definitions for DAMAGE_PROPERTY, TOR_F_SCALE, TOR_LENGTH, TOR_WIDTH and the TOR_OTHER fields.
- National Weather Service. NWS Instruction 10-1605, Storm Data Preparation (26 July 2021). Damage estimates (section 2.7) and direct and indirect fatalities (section 2.6).
- NOAA Storm Prediction Center, Enhanced Fujita Scale. Rating definitions.
- National Weather Service tornado safety. Safety guidance.
- US Census Bureau Population Estimates, Vintage 2025. 2025 resident population, used for per resident figures.
- No survey, interview or physical inspection was conducted for this report. Every figure is computed at build time from the retrieved public files.