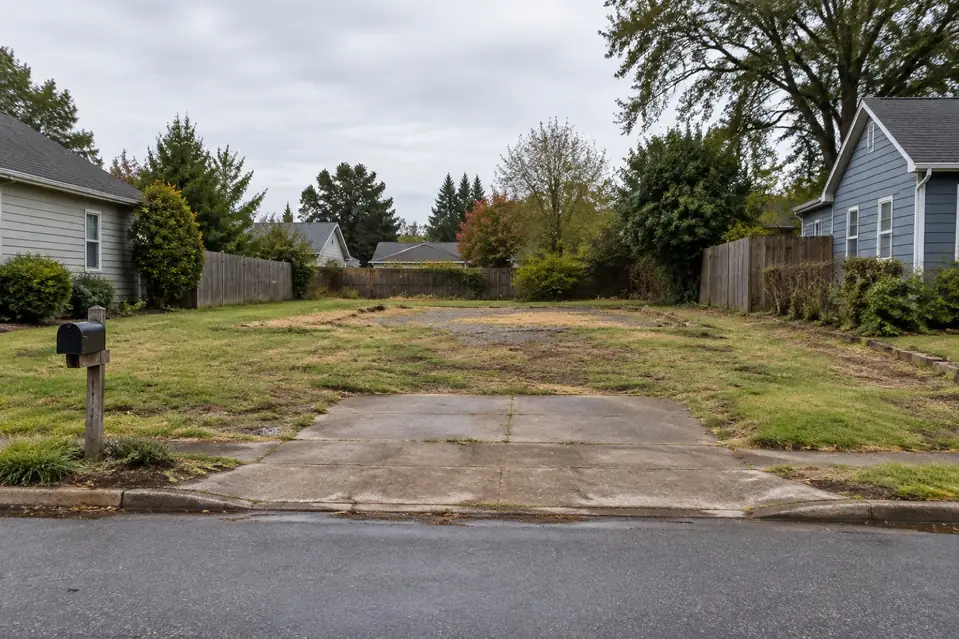
The finding
FEMA buyouts by state are led by Texas, Missouri and North Carolina, which together account for 30.1% of every property FEMA mitigation grants have paid to acquire. Across 5,848 funded acquisition projects in program years 1989 to 2025, FEMA obligated $4.28 billion in federal share to buy out 55,805 properties, a median of $70,197 in federal money per property. Buyouts take 18.8% of all federal Hazard Mitigation Assistance dollars, the largest single category of federal hazard mitigation money.
Headline figures
In this report
- The dollar figure that is not spending
- FEMA buyouts by state: the ranking
- Buyouts per resident
- The counties where buyouts cluster
- Federal cost per property across program years
- Which program pays for buyouts
- How often buyout applications are turned down
- What else mitigation money buys
- Buyout, elevation or relocation
- What this means for rebuilding work
- Method
- Reproduce this
- What this does not show
- Questions this report answers
- Sources
Key findings
- Texas has bought out the most properties with FEMA mitigation grants, 6,223 across 265 funded projects. Texas also leads on federal dollars at $639.3 million.
- Harris County, Texas alone accounts for 3,330 properties, 6.0% of the national FEMA buyout count and more than 45 of the 50 states (Puerto Rico included) with any funded buyout.
- Per resident, North Dakota leads with 157.2 bought-out properties per 100,000 people (2025 population), followed by Iowa at 106.8 and West Virginia at 93.4.
- The median federal share per bought-out property rose from $21,902 in program years 1989 to 1994 to $238,846 in 2020 to 2025, in nominal dollars. The later median is 10.9 times the earlier one, over a period in which the median project shrank from 11 properties to 1.
- The Hazard Mitigation Grant Program, which is triggered by a disaster declaration, funded 89.6% of all bought-out properties in the FEMA data.
- 55.3% of decided Pre-Disaster Mitigation buyout applications were denied or not selected, against 1.0% under HMGP.
- The projectAmount field sums to $74.49 billion across all 56,410 FEMA HMA rows, 3.3 times the $22.73 billion in federal share actually obligated on funded projects. Most of the gap is pending, denied and withdrawn applications.
- The median benefit-cost ratio on funded buyouts with a recorded ratio is 1.43, from 3,812 FEMA projects, below the 1.70 median across all funded HMA project types.
The dollar figure that is not spending
Start with the number most likely to be misquoted. The FEMA Hazard Mitigation Assistance Projects file carries a field called projectAmount, and summed across every row it comes to $74.49 billion. That is not money spent. The file holds every application FEMA has logged, including 5,198 still pending, which alone carry $23.66 billion in projectAmount, plus denied, withdrawn, void and not-selected projects.
This report uses federalShareObligated on funded projects throughout. That totals $22.73 billion for all project types, against $22.75 billion across every row, which confirms that unfunded applications carry almost no obligated federal money. Even restricted to funded projects, projectAmount ($43.31 billion) is a different measure: it is the project cost, which includes the non-federal match that states and localities pay.
FEMA buyouts by state: the ranking
| State | Funded projects | Properties acquired | Federal share | Median federal per property |
|---|---|---|---|---|
| Texas | 265 | 6,223 | $639.3 million | $79,772 |
| Missouri | 196 | 5,512 | $90.2 million | $31,323 |
| North Carolina | 400 | 5,070 | $460.9 million | $73,015 |
| Illinois | 219 | 3,881 | $166.7 million | $45,770 |
| Iowa | 236 | 3,463 | $177.7 million | $46,633 |
| New Jersey | 90 | 2,331 | $395.3 million | $182,087 |
| Ohio | 253 | 2,311 | $98.8 million | $49,611 |
| Louisiana | 206 | 2,121 | $315.7 million | $120,397 |
| Pennsylvania | 398 | 1,938 | $190.5 million | $68,693 |
| Georgia | 168 | 1,837 | $128.7 million | $87,232 |
| West Virginia | 291 | 1,653 | $90.0 million | $52,898 |
| Indiana | 133 | 1,480 | $53.2 million | $41,042 |
| Kentucky | 313 | 1,464 | $170.3 million | $79,836 |
| Kansas | 62 | 1,439 | $30.5 million | $23,335 |
| New York | 218 | 1,307 | $125.8 million | $76,515 |
| Alabama | 146 | 1,300 | $52.3 million | $46,990 |
| North Dakota | 110 | 1,252 | $79.4 million | $51,066 |
| Minnesota | 127 | 1,171 | $60.0 million | $64,206 |
| Tennessee | 191 | 1,127 | $73.2 million | $70,128 |
| Wisconsin | 165 | 1,006 | $68.8 million | $65,702 |
Property counts and dollars rank states differently. Missouri is second on properties with 5,512 but received $90.2 million in federal share, because 85.5% of its acquired properties come from program years before 2000, when the median federal outlay per property was far lower. The national median in program years 1989 to 1994 was $21,902. On dollars the order is Texas ($639.3 million), North Carolina ($460.9 million) and New Jersey ($395.3 million), according to FEMA’s obligation records.
The highest median federal share per property among states with enough projects to measure is New Jersey at $182,087, followed by California at $156,465. The lowest is Kansas at $23,335. Those medians mix program years, so a state whose buyouts are recent will read higher than one whose buyouts are old, even before local property values enter the picture. FEMA buyout demand tracks flood history, which our flood claims by state report sets out from the NFIP claims side.
Buyouts per resident
| State | Properties acquired | Per 100,000 residents | Funded projects |
|---|---|---|---|
| North Dakota | 1,252 | 157.2 | 110 |
| Iowa | 3,463 | 106.8 | 236 |
| West Virginia | 1,653 | 93.4 | 291 |
| Missouri | 5,512 | 88.3 | 196 |
| Vermont | 394 | 60.8 | 229 |
| Kansas | 1,439 | 48.4 | 62 |
| Louisiana | 2,121 | 46.1 | 206 |
| North Carolina | 5,070 | 45.9 | 400 |
| Kentucky | 1,464 | 31.9 | 313 |
| Illinois | 3,881 | 30.5 | 219 |
| Nebraska | 539 | 26.9 | 43 |
| Alabama | 1,300 | 25.2 | 146 |
Scaled to population, the order changes. North Dakota has 157.2 FEMA-funded buyout properties per 100,000 residents, Iowa 106.8 and West Virginia 93.4. In those three states 97.8% of funded buyout projects list a riverine acquisition type, so this is mostly a river-flood record, and the number of properties involved is large relative to the state’s population.
Florida sits at rank 35 of 37 on this measure, with 726 properties acquired across 243 FEMA-funded projects, 3.1 per 100,000 residents. Its median federal share per property is $127,954. The FEMA buyout record and the flood-exposure record are different things; see the flood zone exposure report for where structures sit relative to mapped flood zones.
The ratio has a mismatch built in, and it should be read with it in view: the numerator accumulates over more than three decades while the denominator is a single current-year population. It ranks how large the buyout record is relative to the state today, not a rate per year.
The counties where buyouts cluster
| County | State | Funded projects | Properties acquired | Federal share | Share of US buyout properties |
|---|---|---|---|---|---|
| Harris | Texas | 71 | 3,330 | $352.1 million | 6.0% |
| St. Charles | Missouri | 10 | 1,447 | $8.5 million | 2.6% |
| Lenoir | North Carolina | 12 | 768 | $26.4 million | 1.4% |
| Passaic | New Jersey | 24 | 762 | $130.3 million | 1.4% |
| St. Louis | Missouri | 35 | 721 | $23.8 million | 1.3% |
| Galveston | Texas | 3 | 611 | $80.4 million | 1.1% |
| St. Clair | Illinois | 14 | 527 | $8.5 million | 0.9% |
| Jefferson | Missouri | 15 | 523 | $8.7 million | 0.9% |
| Pitt | North Carolina | 16 | 521 | $20.6 million | 0.9% |
| Lincoln | Missouri | 3 | 510 | $2.5 million | 0.9% |
| Middlesex | New Jersey | 5 | 505 | $100.3 million | 0.9% |
| Monroe | Illinois | 3 | 502 | $10.0 million | 0.9% |
| Black Hawk | Iowa | 20 | 501 | $17.0 million | 0.9% |
| Chatham | Georgia | 32 | 495 | $22.5 million | 0.9% |
| Beaufort | North Carolina | 18 | 493 | $15.4 million | 0.9% |
Harris County, Texas stands apart: 3,330 properties across 71 funded FEMA projects and $352.1 million in federal share. That is 6.0% of every property in the national FEMA buyout record. The top 15 counties together hold 21.9%. Buyouts are a concentrated program: a short list of counties accounts for a large share of the properties acquired.
4 of the 15 counties in the table reached their totals with 5 or fewer funded projects rather than a steady stream, so a county ranking says more about the scale of one or two past floods than about current activity. FEMA’s records attach each project to one primary county, and multi-county projects are counted once under that county.
Federal cost per property across program years
| Program years | Funded projects | Properties acquired | Federal share | Median federal per property | Projects not yet closed |
|---|---|---|---|---|---|
| 1989 to 1994 | 340 | 10,882 | $199.2 million | $21,902 | 3 |
| 1995 to 1999 | 1,059 | 13,325 | $542.1 million | $41,612 | 47 |
| 2000 to 2004 | 869 | 6,319 | $369.0 million | $56,698 | 59 |
| 2005 to 2009 | 948 | 9,282 | $771.5 million | $83,416 | 16 |
| 2010 to 2014 | 1,056 | 7,382 | $793.8 million | $94,993 | 14 |
| 2015 to 2019 | 1,034 | 6,554 | $889.1 million | $99,822 | 193 |
| 2020 to 2025 | 542 | 2,061 | $715.0 million | $238,846 | 409 |
The property count peaked in program years 1995 to 1999, with 13,325 properties acquired. The money moved the other way. The median federal share per property was $21,902 in 1989 to 1994 and $238,846 in 2020 to 2025, so recent FEMA buyouts acquire fewer properties at a higher federal cost each. Part of that is the shape of the projects: the median project bought 11 properties in 1989 to 1994 and 1 in 2020 to 2025, so recent medians describe single-home acquisitions rather than neighbourhood-scale ones, and the data cannot separate that shift from rising house prices. These are nominal dollars; for how much of a similar rise in flood losses is price level, see inflation-adjusted flood damage.
The latest bin needs care. 409 of its 542 projects were still approved or obligated rather than closed at retrieval, so final property counts and obligations can still change, and its median rests on 303 projects.
Which program pays for buyouts
| Program | Full name | Buyout projects | Properties | Federal share | Median federal per property | Buyouts as share of program’s funded projects |
|---|---|---|---|---|---|---|
| HMGP | Hazard Mitigation Grant Program | 4,730 | 50,002 | $3,426.6 million | $62,500 | 13.2% |
| FMA | Flood Mitigation Assistance | 728 | 2,700 | $489.8 million | $116,278 | 27.4% |
| PDM | Pre-Disaster Mitigation | 213 | 2,168 | $183.3 million | $89,932 | 5.1% |
| SRL | Severe Repetitive Loss | 82 | 558 | $105.0 million | $194,217 | 32.5% |
| LPDM | Legislative Pre-Disaster Mitigation | 29 | 118 | $29.1 million | $123,647 | 5.0% |
| RFC | Repetitive Flood Claims | 46 | 124 | $24.2 million | $222,833 | 43.4% |
| BRIC | Building Resilient Infrastructure and Communities | 20 | 135 | $21.8 million | Too few | 4.7% |
HMGP, the post-disaster program, carries the buyout record: 89.6% of acquired properties and $3,426.6 million of federal share. The most buyout-heavy programs in their own portfolios are RFC (Repetitive Flood Claims) at 43.4% of its funded projects and SRL (Severe Repetitive Loss) at 32.5%. The same two programs show the highest median federal share per property. The addresses those programs target are tracked in the repetitive flood loss properties report.
How often buyout applications are turned down
| Program | Decided | Funded | Denied or not selected | Withdrawn or void | Still pending | Turned-down rate |
|---|---|---|---|---|---|---|
| HMGP | 4,923 | 4,730 | 51 | 142 | 204 | 1.0% |
| FMA | 982 | 728 | 209 | 45 | 130 | 21.3% |
| PDM | 476 | 213 | 263 | 0 | 0 | 55.3% |
| SRL | 98 | 82 | 16 | 0 | 4 | 16.3% |
| RFC | 62 | 46 | 16 | 0 | 5 | 25.8% |
| LPDM | 37 | 29 | 8 | 0 | 0 | 21.6% |
| BRIC | 25 | 20 | 5 | 0 | 0 | Fewer than 30 decisions |
The competitive programs turn down far more buyout applications than the disaster-triggered one. PDM has the highest turned-down rate at 55.3%; HMGP sits at 1.0%, although 142 HMGP buyout projects were withdrawn or voided, which this rate does not count as turned down. Under HMGP the state is the grant recipient and selects which local subapplications to submit, so screening that happens before submission does not appear in the federal record. The rates compare what reached FEMA, not what communities asked for.
What else mitigation money buys
| Category | Funded projects | Federal share | Share of federal dollars |
|---|---|---|---|
| Property acquisition (buyouts) | 5,848 | $4,279.8 million | 18.8% |
| Utility and infrastructure protection | 2,765 | $2,845.1 million | 12.5% |
| Wind, seismic and wildfire retrofits | 3,247 | $2,658.2 million | 11.7% |
| Structure elevation | 1,947 | $2,241.1 million | 9.9% |
| Drainage and stormwater | 3,326 | $2,216.8 million | 9.8% |
| Safe rooms | 3,216 | $1,536.8 million | 6.8% |
| Management costs | 3,236 | $1,431.3 million | 6.3% |
| Generators | 4,699 | $1,418.5 million | 6.2% |
| Studies, codes and education | 2,446 | $1,030.3 million | 4.5% |
| Vegetation, slope and shoreline work | 1,127 | $787.9 million | 3.5% |
| Mitigation planning | 7,944 | $667.7 million | 2.9% |
| Miscellaneous | 426 | $605.5 million | 2.7% |
| Major flood control | 330 | $387.8 million | 1.7% |
| Warning systems | 2,152 | $297.1 million | 1.3% |
| Other equipment | 485 | $105.4 million | 0.5% |
| Mitigation reconstruction | 183 | $93.4 million | 0.4% |
| Floodproofing | 209 | $71.7 million | 0.3% |
| Structure relocation | 116 | $47.6 million | 0.2% |
| Other or unspecified | 286 | $5.9 million | 0.0% |
Buyouts are the single largest line, but 81.2% of mitigation money goes elsewhere. Utility and infrastructure protection takes 12.5%, wind, seismic and wildfire retrofits 11.7% and structure elevation 9.9%. By count the most common category is mitigation planning, with 7,944 funded projects and 2.9% of federal dollars. For the state-by-state view of all FEMA program money, see FEMA spending by state.
Buyout, elevation or relocation
| Approach | Funded projects | Properties | Federal share | Median federal per property |
|---|---|---|---|---|
| Property acquisition (buyouts) | 5,848 | 55,805 | $4,279.8 million | $70,197 |
| Structure elevation | 1,947 | 15,314 | $2,241.1 million | $94,949 |
| Structure relocation | 116 | 303 | $47.6 million | $66,229 |
Elevation is the main alternative to a buyout: 15,314 properties across 1,947 funded FEMA projects, against 55,805 acquired. Its median federal share per property, $94,949, is above the acquisition median of $70,197. The two medians cover different years and housing stock, so the gap does not say what elevating or buying any given home costs. Relocation, moving a structure off the floodplain, is rare at 303 properties.
What this means for rebuilding work
For restoration contractors the two main structure approaches point in opposite directions. Under FEMA’s Hazard Mitigation Assistance rules, land acquired with these grants is deed-restricted to open space, so an acquired structure is an address that leaves the repair cycle for good once it is demolished or moved. 55,689 of the 55,805 acquired properties sit on projects that list a structures-and-land acquisition type rather than vacant land only. Elevation does the opposite: each of the 15,314 elevated properties in the FEMA record stays on site and is raised, which is construction work on an existing building.
The data in this report describe where that money has gone. They do not say whether any particular property is eligible, whether a buyout or elevation is the right choice for an owner, or what an owner would receive. Those decisions run through the state hazard mitigation officer and the local community, and FEMA and FloodSmart publish the program rules.
Method
How we counted. We retrieved all 56,410 rows of FEMA OpenFEMA HazardMitigationAssistanceProjects v4 on 5 October 2026. A project counts as funded when its status is Closed, Approved or Obligated, which leaves 43,988 rows. The 12,422 excluded rows by status are: Pending 5,198; Not Approved / Denied 4,190; Withdrawn 1,445; Not Selected 731; Void 469; Awarded 200; Completed 68; Revision Requested 24; No status recorded 97. Awarded and Completed appear only on a small number of FMA rows and are excluded rather than guessed at. Money is federalShareObligated, never projectAmount, because projectAmount totals $74.49 billion across all rows including unfunded applications and includes the non-federal match even on funded ones. A project is a buyout when any of its listed project types carries a code beginning 200, the FEMA acquisition family (private and public structures and land, riverine, coastal, landslide, erosion and other hazards, plus vacant land). 263 of the 5,848 funded buyout projects also list a non-acquisition type such as elevation or drainage; they stay in buyout counts and totals, and are left out of per-property medians. Property counts use numberOfFinalProperties, the count after scope changes, rather than numberOfProperties, the proposed count, which sums to 75,528 for the same projects. 862 funded buyout projects record zero final properties (760 of them list a proposed count) and contribute dollars but no properties. 752 record no positive federal share. Median federal share per property is computed per project on single-purpose acquisition projects with both a positive federal share and a positive final property count (4,562 projects), then the median is taken; the pooled ratio of dollars to properties on the same projects is $71,267. Benefit-cost ratios are used only where above zero (3,812 buyout projects; 2,036 carry zero) and only medians are reported. netValueBenefits is not summed or reported. Program year is the programFy field. State tables cover the 50 states, the District of Columbia and Puerto Rico; 8 buyout projects in other territories stay in national totals. Per-resident figures use the Census Bureau Vintage 2025 estimates and require at least 25 funded projects. No inflation adjustment is applied.
Reproduce this
Reproduce this
- Endpoint
https://www.fema.gov/api/open/v4/HazardMitigationAssistanceProjects- Query
$select=projectIdentifier,programArea,programFy,state,county,projectType,status,federalShareObligated,projectAmount,benefitCostRatio,netValueBenefits,numberOfFinalProperties,numberOfProperties,costSharePercentage&$top=10000 paged with $skip- Rows retrieved
- 56,410 project rows
- Retrieved
- 5 October 2026
No API key is required. OpenFEMA returns every value, including numbers, and some fields contain the literal string None, so coerce before summing. Filter status to Closed, Approved or Obligated, split projectType on semicolons, and flag a project as a buyout when any component code starts with 200. Sum federalShareObligated, not projectAmount.
What this does not show
What this does not show
- Federal share only. The state and local match is excluded. 74.7% of funded buyout projects carry a 75% federal cost share, so the full cost of a typical buyout is higher than the federal figure.
- Federal share per property is not a purchase price. It covers the federal portion of acquisition, demolition, closing and project costs. It is not what an owner received.
- Program year is not completion year. programFy is the grant program year, and a buyout can close many years later.
- Recent projects are still open. 741 funded buyout projects (12.7%) were approved or obligated rather than closed at retrieval, so their properties and obligations can still change.
- Final property counts are incomplete. 862 funded buyout projects record zero final properties. The proposed-count total is 19,723 higher than the final-count total used here.
- Not all acquisitions are homes. The 200 family includes public buildings and vacant land, and property counts do not distinguish houses from other structures.
- Buyouts outside FEMA are not here. HUD Community Development Block Grant buyouts, state-funded programs and local programs do not appear in this file.
- Nominal dollars. Per-property figures across program years are not adjusted for inflation.
Most quotable figures
- FEMA hazard mitigation grants have funded the buyout of 55,805 properties since program year 1989, with $4.28 billion in federal share (FEMA OpenFEMA HMA Projects v4, retrieved 5 October 2026).
- Texas leads FEMA buyouts by state with 6,223 properties acquired, and Harris County alone accounts for 6.0% of the national total (FEMA OpenFEMA HMA Projects v4, retrieved 5 October 2026).
- The median federal share per FEMA-funded buyout property rose from $21,902 in program years 1989 to 1994 to $238,846 in 2020 to 2025, nominal, while the median project shrank from 11 properties to 1 (FEMA OpenFEMA HMA Projects v4, retrieved 5 October 2026).
- Buyouts take 18.8% of the $22.73 billion in federal share obligated on funded Hazard Mitigation Assistance projects (FEMA OpenFEMA HMA Projects v4, retrieved 5 October 2026).
- 55.3% of decided Pre-Disaster Mitigation buyout applications were denied or not selected, against 1.0% under the Hazard Mitigation Grant Program (FEMA OpenFEMA HMA Projects v4, retrieved 5 October 2026).
- North Dakota has the most FEMA-funded buyouts per resident, 157.2 properties per 100,000 people (FEMA OpenFEMA HMA Projects v4, retrieved 5 October 2026); population from Census Vintage 2025.
Questions this report answers
Which state has the most FEMA buyouts?
Texas, with 6,223 properties acquired across 265 funded projects, then Missouri (5,512) and North Carolina (5,070). By federal dollars the leader is Texas at $639.3 million.
How much does FEMA pay per bought-out property?
The median federal share is $70,197 per property, with the middle half of projects between $36,901 and $137,021. That is the federal portion of project costs, not the price paid to an owner, and 74.7% of funded buyout projects carry a 75% federal cost share.
How many homes has FEMA bought out?
FEMA’s mitigation project file records 55,805 properties acquired on 5,848 funded projects since program year 1989, using the final property count. Not every acquired property is a house; the category also covers public buildings and vacant land.
Which FEMA program funds most buyouts?
The Hazard Mitigation Grant Program, which follows a disaster declaration, accounts for 89.6% of acquired properties and $3,426.6 million of federal share.
Is the $74.5 billion in the FEMA mitigation file money spent?
No. That is projectAmount summed over every row, including pending, denied and withdrawn applications. Federal share obligated on funded projects is $22.73 billion.
Can I reuse these figures?
Yes. The tables and derived figures are released under CC BY 4.0 with attribution to Remediation Insider. The FEMA data is public and reproducible from the endpoint listed above. For decisions about a specific property, contact the state hazard mitigation officer or FEMA.
How to cite
Remediation Insider. FEMA Buyouts by State: Where Hazard Mitigation Money Buys Out Homes. https://remediationinsider.com/fema-buyouts-by-state/ (retrieved 5 October 2026).
Data and tables in this report are released under CC BY 4.0. Attribution: Remediation Insider.
Sources
- Federal Emergency Management Agency. FEMA OpenFEMA Hazard Mitigation Assistance Projects, v4. 56,410 project rows, retrieved 5 October 2026.
- FEMA OpenFEMA API documentation.
- FEMA Hazard Mitigation Assistance grants, for program scope and the open-space requirement on acquired land.
- US Census Bureau Population Estimates, Vintage 2025, for per-resident figures.
- FEMA OpenFEMA Terms and Conditions.
- No survey, interview or physical inspection was conducted for this report. Every figure is computed at build time from the retrieved FEMA file.
This product uses the Federal Emergency Management Agency’s OpenFEMA API, but is not endorsed by FEMA. The Federal Government or FEMA cannot vouch for the data or analyses derived from these data after the data have been retrieved from the Agency’s website(s).