The finding
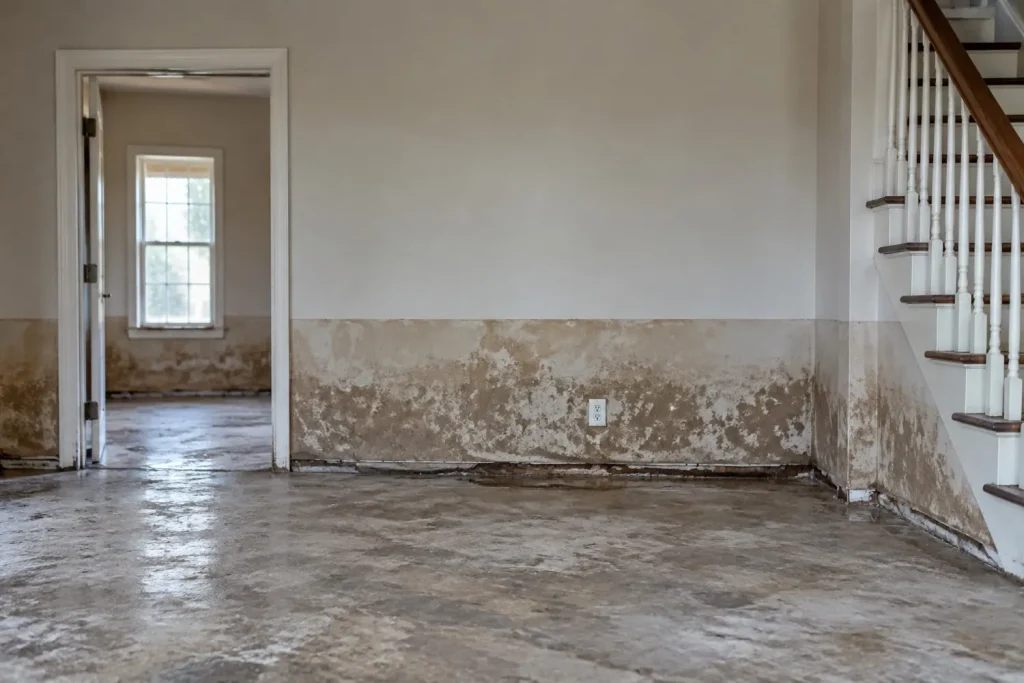
Water depth damage in flood losses follows a curve, not a straight line. Across 626,886 National Flood Insurance Program claims filed since 2015, median building damage rises from $18,842 at under one foot of water to $63,020 at two feet, a 3.3 times increase. Above roughly three feet the curve flattens. The first two feet of water do most of the financial damage.
Headline figures
In this report
Key findings
- Median building damage at two feet of water ($63,020) is 3.3 times the median under one foot ($18,842).
- The steepest single step is the first foot: median damage rises 2.2 times from under one foot to one foot.
- Above three feet the curve flattens. Median damage at five feet ($68,449) is close to the two foot figure, not double it.
- 260,817 claims (42.3%) are coded as a combination of causes including sewer backup, the single largest cause category.
- Only 403,505 of 626,886 claims carry both a plausible depth and a damage amount, which is the sample this analysis uses.
- 13,551 claims record a depth of exactly 99 feet, which is a sentinel value rather than a measurement.
- 17,085 claims record a negative depth, which the dataset uses for water below the first floor.
The finding in one chart
Why the first two feet matter most
The shape of this curve is not obvious in advance. It would be reasonable to expect damage to scale with depth, because more water means more wet material. That is not what the claims show. Our contents restoration report tests whether contents damage follows the same curve.
Median damage climbs steeply through the first two feet, from $18,842 to $63,020, then effectively plateaus. A plausible reading is that the first two feet already reach the components that cost the most to replace: flooring, underlay, the bottom of the drywall, baseboards, cabinetry, and mechanical equipment sitting at floor level. Once those are gone, additional depth adds wall height but little new category of loss until the water reaches a second storey. Our guide to flood damage restoration explains where flood cuts are made and why.
This is an association in claims data, not a causal finding. The claims record what was paid, not what was physically destroyed, and deeper floods differ from shallow ones in more ways than depth.
Median damage foot by foot
| Water depth | Claims | Median building damage | Mean building damage |
|---|---|---|---|
| 0 ft | 113,601 | $18,842 | $45,375 |
| 1 ft | 148,318 | $41,296 | $64,402 |
| 2 ft | 60,260 | $63,020 | $87,494 |
| 3 ft | 30,627 | $68,621 | $94,225 |
| 4 ft | 17,844 | $71,906 | $103,411 |
| 5 ft | 10,364 | $68,449 | $102,761 |
| 6 ft | 7,392 | $53,651 | $94,140 |
| 7 ft | 4,943 | $51,050 | $93,523 |
| 8 ft | 4,608 | $48,336 | $97,192 |
| 9 ft | 2,812 | $54,644 | $113,990 |
| 10 ft | 2,736 | $55,830 | $103,770 |
What causes the water
| Cause of damage | Claims | Share |
|---|---|---|
| Combination of causes, including sewer backup | 260,817 | 42.3% |
| Stream, river or lake overflow | 137,758 | 22.3% |
| Tidal water overflow | 108,346 | 17.6% |
| Other causes | 106,967 | 17.4% |
| Accumulation of rainfall or snowmelt | 1,377 | 0.2% |
| Code D | 571 | 0.1% |
| Code A | 347 | 0.1% |
| Code B | 181 | 0.0% |
The largest single category is a combination of causes that includes sewer backup. For a restoration contractor that matters because it signals a contaminated loss rather than a clean one, which changes what can be dried in place and what has to be removed. Our guide to IICRC water categories covers that distinction.
Claims by year
| Loss year | Claims in this sample |
|---|---|
| 2015 | 34,581 |
| 2016 | 85,497 |
| 2017 | 145,681 |
| 2018 | 42,625 |
| 2019 | 35,312 |
| 2020 | 33,185 |
| 2021 | 46,699 |
| 2022 | 60,262 |
| 2023 | 21,690 |
| 2024 | 102,054 |
| 2025 | 13,143 |
| 2026 | 6,157 |
Data quality: the depth field is dirty
Most published work using this dataset does not say what follows, so we are stating it plainly. The water depth field cannot be used as retrieved.
| Issue | Claims affected | How we handled it |
|---|---|---|
| Depth recorded as exactly 99 feet | 13,551 | Excluded. This is a sentinel value, not a measurement. |
| Negative depth | 17,085 | Excluded from the curve. The dataset uses negative values for water below the first floor level. |
| Depth above 20 feet | 30,953 | Excluded. Residential flood depths above 20 feet are not plausible at this frequency. |
| No depth recorded | 76,981 | Excluded from depth analysis, retained for cause and year counts. |
After those exclusions the analysis sample is 403,505 claims, which is 64% of the retrieved rows. Every figure above is computed on that sample.
Method
How we counted. We retrieved 626,886 NFIP redacted claim records with a loss year of 2015 or later from the FEMA OpenFEMA API on 4 October 2026. We kept claims with a recorded water depth between 0 and 10 feet and a non-zero building damage amount, which leaves 403,505 claims. We grouped those by whole foot of depth and computed the median and mean building damage amount for each bucket, reporting only buckets with at least 200 claims. Medians are reported in preference to means because the distribution is right skewed. No inflation adjustment is applied, so figures across years are nominal.
Reproduce this
Reproduce this
- Endpoint
https://www.fema.gov/api/open/v3/NfipClaims- Query
$filter=yearOfLoss ge 2015&$select=state,yearOfLoss,waterDepth,causeOfDamage,buildingDamageAmount,contentsDamageAmount,amountPaidOnBuildingClaim,occupancyType- Rows retrieved
- 626,886 claims
- Retrieved
- 4 October 2026
The API pages at 5,000 rows via $top and $skip. No API key is required. Re-running this query will return a larger set as newer claims are added.
What this does not show
What this does not show
- These are insured flood losses only. NFIP covers policyholders. Uninsured flood damage, and every water loss that is not a flood (burst pipes, appliance failures, sewer backups outside a flood event) is absent from this dataset entirely.
- Damage amount is not restoration cost. The field records the assessed damage on the claim, which is not the same as what a contractor billed or what the work cost.
- Depth is self-reported on the claim. The data quality section above shows how unreliable the field is before cleaning.
- No inflation adjustment. Figures spanning 2015 to 2026 are nominal dollars.
- Association, not causation. Deeper floods differ from shallow floods in duration, contamination and building type, not only in depth.
Most quotable figures
- Median NFIP building damage rises 3.3 times across the first two feet of water, from $18,842 to $63,020 (FEMA OpenFEMA NFIP claims, 2015 to 2026, n = 403,505).
- Above three feet the damage curve flattens: median damage at five feet is $68,449, close to the two foot figure.
- 42.3% of NFIP claims since 2015 are coded as a combination of causes including sewer backup.
- 13,551 NFIP claims record a water depth of exactly 99 feet, a sentinel value that must be excluded before analysis.
Questions this report answers
How much damage does one foot of water cause?
In NFIP claims filed since 2015, the median building damage amount at one foot of water is $41,296, against $18,842 at under one foot.
Does damage keep rising with depth?
Not proportionally. Median damage climbs steeply to about three feet and then flattens. At five feet the median is $68,449, not far above the two foot figure of $63,020.
Why is the first foot so expensive?
A plausible reading is that the first foot already reaches flooring, underlay, the base of the drywall, baseboards and floor-level mechanical equipment. Those are the components that cost most to replace, and additional depth adds wall area rather than new categories of loss.
Does this cover burst pipes and appliance leaks?
No. NFIP covers flood losses for policyholders only. Water losses from plumbing failures are not in this dataset.
Is the water depth field reliable?
Not as retrieved. 13,551 claims record exactly 99 feet and 17,085 record a negative depth. We exclude both, along with depths above 20 feet.
What is the largest cause of NFIP flood damage?
A combination of causes including sewer backup, at 42.3% of claims since 2015.
Can I reuse this data?
Yes. The tables and derived figures are released under CC BY 4.0 with attribution to Remediation Insider. The underlying claims data is public and available from FEMA.
How to cite
Remediation Insider. The Water Depth Damage Curve. https://remediationinsider.com/water-depth-damage-curve/ (retrieved 4 October 2026).
Data and tables in this report are released under CC BY 4.0. Attribution: Remediation Insider.
Sources
- Federal Emergency Management Agency. FEMA OpenFEMA NFIP Redacted Claims, v3. Claims with loss year 2015 or later. 626,886 records retrieved 4 October 2026.
- FEMA OpenFEMA Terms and Conditions.
- Cause of damage code labels are taken from the FEMA OpenFEMA data dictionary for the NfipClaims dataset.
- No survey, interview or physical inspection was conducted for this report. Every figure is computed from the retrieved claims file.
This product uses the Federal Emergency Management Agency’s OpenFEMA API, but is not endorsed by FEMA. The Federal Government or FEMA cannot vouch for the data or analyses derived from these data after the data have been retrieved from the Agency’s website(s).