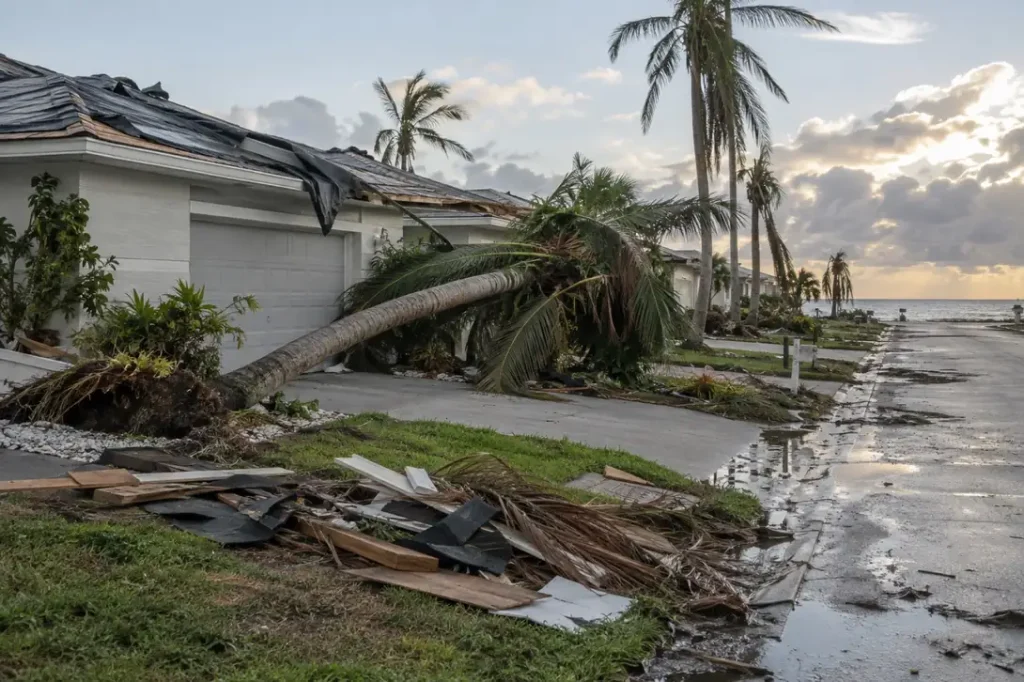
The finding
Ranked as hurricane damage by state, NOAA Storm Events records for 2015 to 2025 put Florida, Louisiana and Texas ahead of every other state, with $10.1 billion or more each against $3.2 billion for Georgia in fourth. Florida carries $38.4 billion of the $81.5 billion in property damage that NOAA logged under hurricane, tropical storm and storm surge event types in the 50 states and DC, or 47%. Louisiana follows with $26.7 billion, the most per resident. Five storm episodes hold 58% of the national total. The ledger also misses storm flooding: Puerto Rico, where FEMA has obligated $37.4 billion in Public Assistance for hurricane declarations, shows $5.0 million in these rows and $18.3 billion in flood rows filed under the same NOAA episodes.
Headline figures
In this report
- The state ranking
- Wind, surge and tropical storm rows
- Five episodes, most of the money
- Deaths do not follow dollars
- Year by year
- Puerto Rico, Guam and the island areas
- The flood rows behind the storms
- NOAA damage against FEMA spending
- Not the billion-dollar record
- Data treatment
- Method
- Reproduce this
- What this does not show
- Questions this report answers
- Sources
Key findings
- Florida, Louisiana and Texas hold 92% of the $81.5 billion in hurricane, tropical storm and storm surge property damage NOAA recorded in the 50 states and DC from 2015 to 2025.
- Per resident, Louisiana leads at $5,799 of recorded damage for every 2025 resident, against $1,643 in Florida (NOAA, Census Vintage 2025).
- The single costliest episode, Ian in Florida (September 2022), carries $13.2 billion, and the 5 costliest episodes hold 58% of all recorded damage across 468 episodes (NOAA).
- Rows typed Hurricane (Typhoon) are 9% of records but 79% of damage; the median positive estimate is $34.0 million for a hurricane row and $62,000 for a tropical storm row (NOAA).
- Flash Flood and Flood rows that NOAA filed under the same 160 storm episodes add $66.1 billion and 195 deaths that a hurricane-type ranking misses; $43.7 billion of it is in Texas, against $10.1 billion in the Texas hurricane-type rows (NOAA).
- NOAA’s damage ranking and FEMA’s hurricane Public Assistance ranking agree closely at the top (Spearman 0.92 across 15 states), but New York ranks 5th for FEMA money and 10th for NOAA damage (NOAA, OpenFEMA).
- For 2015 to 2024, NOAA’s own billion-dollar archive costs 29 tropical cyclones at $699.7 billion unadjusted; the Storm Events rows for the same years sum to $87.6 billion, 13% of that (NOAA).
The state ranking
The table sums property damage across four NOAA event types: Hurricane (Typhoon), Storm Surge/Tide, Tropical Storm and Tropical Depression, kept in separate columns so wind and water can be read apart. These events are recorded by NWS forecast zone rather than county (NWS Instruction 10-1605, Storm Data Preparation (26 July 2021)), so the finest geography the file supports for them is the state. Damage is in nominal dollars as entered by NWS offices. Source: NOAA NCEI Storm Events.
| State | Hurricane rows | Storm surge rows | Tropical storm rows | Combined | Deaths | Episodes | Damage per resident |
|---|---|---|---|---|---|---|---|
| Florida | $30.8 billion | $2.7 billion | $5.0 billion | $38.4 billion | 291 | 98 | $1,643 |
| Louisiana | $22.1 billion | $3.7 billion | $853.8 million | $26.7 billion | 58 | 29 | $5,799 |
| Texas | $6.1 billion | $589.0 million | $3.4 billion | $10.1 billion | 14 | 38 | $322 |
| Georgia | $2.4 billion | $13.9 million | $858.5 million | $3.2 billion | 42 | 50 | $288 |
| North Carolina | $1.5 billion | $0 | $518.5 million | $2.0 billion | 26 | 44 | $180 |
| South Carolina | $207.0 million | $0 | $336.6 million | $543.7 million | 41 | 43 | $99 |
| Alabama | $313.4 million | $19.5 million | $4.5 million | $337.5 million | 3 | 25 | $65 |
| Mississippi | $99.5 million | $20.2 million | $24.2 million | $144.0 million | 2 | 24 | $49 |
| Connecticut | $0 | $0 | $54.3 million | $54.3 million | 1 | 8 | $15 |
| New York | $0 | $0 | $18.9 million | $18.9 million | 7 | 5 | under $1 |
| Virginia | $0 | $0 | $4.2 million | $4.2 million | 0 | 10 | under $1 |
| Maryland | $0 | $0 | $3.0 million | $3.0 million | 1 | 8 | under $1 |
| Rhode Island | $0 | $0 | $1.9 million | $1.9 million | 0 | 4 | $2 |
| Massachusetts | $0 | $0 | $591,800 | $591,800 | 0 | 8 | under $1 |
| Arkansas | $0 | $0 | $321,500 | $321,500 | 0 | 6 | under $1 |
| Alaska | $0 | $77,000 | $0 | $77,000 | 0 | 4 | under $1 |
| New Hampshire | $0 | $0 | $55,000 | $55,000 | 1 | 1 | under $1 |
| Maine | $0 | $0 | $40,000 | $40,000 | 1 | 4 | under $1 |
| Hawaii | $0 | $0 | $10,000 | $10,000 | 0 | 4 | under $1 |
A further 4 states logged rows of these types but no positive damage estimate: California (16 rows), Pennsylvania (10 rows), New Jersey (36 rows), Delaware (6 rows). A recorded zero can mean no damage or damage that was not obtained (NOAA NCEI Storm Events).
Louisiana’s per-resident figure ($5,799) is 3.5 times Florida’s, the next highest (NOAA, Census). Other state rankings built from public records are collected in the data hub.
Wind, surge and tropical storm rows
NWS Storm Data keeps storm surge apart from hurricane wind: a Storm Surge/Tide row records the water pushed ashore, a Hurricane (Typhoon) row the wind damage of a hurricane, and a Tropical Storm row the effects of a weaker system (NWS Instruction 10-1605, Storm Data Preparation (26 July 2021), Appendix A). Hurricane rows are few and large; tropical storm rows are many and mostly small. Source: NOAA NCEI Storm Events.
| Event type | Rows | Episodes | Property damage | Rows with an estimate above $0 | Median positive estimate | Deaths |
|---|---|---|---|---|---|---|
| Hurricane (Typhoon) | 379 | 69 | $69.4 billion | 63% | $34.0 million | 267 |
| Tropical Storm | 3,185 | 389 | $11.1 billion | 39% | $62,000 | 210 |
| Storm Surge/Tide | 492 | 134 | $7.0 billion | 22% | $2.9 million | 23 |
| Tropical Depression | 239 | 57 | $20.5 million | 20% | $25,000 | 7 |
Surge is concentrated. Among states with at least $100 million of recorded damage, the surge share is highest in Mississippi (14% of $144.0 million), Louisiana (14% of $26.7 billion) and Florida (7% of $38.4 billion). Storm surge rows carry 23 deaths against 267 for hurricane rows (NOAA). Only 39% of tropical storm rows carry a positive estimate. Source: NOAA NCEI Storm Events.
Five episodes, most of the money
NOAA groups rows into episodes: one weather system as handled by one NWS office, so a single hurricane can span several episodes across offices. Storm names below are taken only from NOAA’s own episode narratives: the name the narrative mentions most often. 22 of 468 episodes name no storm and stay unnamed (NOAA NCEI Storm Events).
| Episode ID | Storm named in narrative | Where | When | Zone rows | Property damage | Deaths |
|---|---|---|---|---|---|---|
| 174632 | Ian | Florida | September 2022 | 24 | $13.2 billion | 90 |
| 162128 | Ida | Louisiana | August 2021 | 46 | $12.1 billion | 29 |
| 152321 | Laura | Louisiana | August 2020 | 18 | $10.7 billion | 23 |
| 130185 | Michael | Florida | October 2018 | 30 | $9.9 billion | 52 |
| 195637 | Helene | Florida | September 2024 | 29 | $5.1 billion | 3 |
| 119859 | Harvey | Texas | August 2017 | 16 | $4.7 billion | 3 |
| 183342 | Mawar | Guam | May 2023 | 3 | $4.0 billion | 2 |
| 153528 | Delta | Louisiana | October 2020 | 18 | $3.3 billion | 4 |
| 119753 | Harvey | Texas | August 2017 | 14 | $2.9 billion | 0 |
| 174305 | Ian | Florida | September 2022 | 14 | $2.2 billion | 12 |
| 110290 | Matthew | Florida | October 2016 | 12 | $2.1 billion | 1 |
| 136010 | Yutu | Guam | October 2018 | 6 | $2.0 billion | 1 |
Grouping episodes by the storm their narratives name, and by year, gives a per-storm view. A storm whose narratives in some offices do not name it is undercounted here. Source: NOAA NCEI Storm Events.
| Storm (as named) | Year | Episodes | States and areas | Property damage | Deaths |
|---|---|---|---|---|---|
| Ian | 2022 | 16 | Florida, Georgia, North Carolina, South Carolina | $15.4 billion | 118 |
| Ida | 2021 | 8 | Alabama, Arkansas, Louisiana, Mississippi | $12.2 billion | 29 |
| Michael | 2018 | 21 | Alabama, Florida, Georgia, Louisiana, Mississippi, North Carolina, South Carolina | $11.4 billion | 53 |
| Laura | 2020 | 13 | Arkansas, Florida, Louisiana, Mississippi, Puerto Rico, Texas, Virgin Islands | $10.7 billion | 25 |
| Harvey | 2017 | 9 | Louisiana, Texas | $7.5 billion | 3 |
| Helene | 2024 | 18 | Alabama, Florida, Georgia, North Carolina, South Carolina | $7.1 billion | 75 |
| Mawar | 2023 | 2 | Guam | $4.0 billion | 2 |
| Irma | 2017 | 13 | Alabama, Florida, Georgia, South Carolina | $3.5 billion | 79 |
| Delta | 2020 | 10 | Arkansas, Louisiana, Mississippi, Texas | $3.4 billion | 4 |
| Matthew | 2016 | 11 | Florida, Georgia, North Carolina, South Carolina | $3.1 billion | 23 |
| Yutu | 2018 | 1 | Guam | $2.0 billion | 1 |
| Florence | 2018 | 7 | North Carolina, South Carolina | $1.7 billion | 13 |
Deaths do not follow dollars
The 2015 to 2025 rows record 507 deaths, 240 of them direct. The deadliest named storm in these rows is Ian (2022), with 118 deaths. Deaths are counted where they were entered, under the event type the NWS office chose, so a drowning in inland flooding from a hurricane sits in a Flash Flood row, outside this table (NOAA NCEI Storm Events).
| State | Deaths | Direct deaths | Damage rank | Recorded damage |
|---|---|---|---|---|
| Florida | 291 | 124 | 1 | $38.4 billion |
| Louisiana | 58 | 14 | 2 | $26.7 billion |
| Georgia | 42 | 34 | 4 | $3.2 billion |
| South Carolina | 41 | 25 | 6 | $543.7 million |
| North Carolina | 26 | 13 | 5 | $2.0 billion |
| Texas | 14 | 1 | 3 | $10.1 billion |
| New York | 7 | 7 | 10 | $18.9 million |
| Alabama | 3 | 1 | 7 | $337.5 million |
| Mississippi | 2 | 1 | 8 | $144.0 million |
| California | 2 | 2 | 20 | $0 |
Year by year
Annual totals swing on single landfalls. 2020 is the costliest year at $17.7 billion, while 2015 ($43.0 million), 2019 ($39.1 million) and 2025 ($0) each sum to less than $100 million (NOAA). 2025 has 17 rows, 0 of them typed Hurricane (Typhoon), and none carries a positive estimate (NOAA). 11 years dominated by a few systems are too few to read a trend, and the dollars are not adjusted for inflation; for that treatment of flood losses see inflation-adjusted flood damage. Source: NOAA NCEI Storm Events.
| Year | Hurricane rows | Surge rows | Tropical storm rows | Combined | Deaths | Largest episode |
|---|---|---|---|---|---|---|
| 2015 | $31.6 million | $1.5 million | $9.9 million | $43.0 million | 14 | Soudelor, Guam ($20.0 million) |
| 2016 | $815.7 million | $220.2 million | $2.3 billion | $3.3 billion | 23 | Matthew, Florida ($2.1 billion) |
| 2017 | $5.8 billion | $585.7 million | $4.6 billion | $11.0 billion | 82 | Harvey, Texas ($4.7 billion) |
| 2018 | $13.8 billion | $1.1 billion | $310.8 million | $15.2 billion | 68 | Michael, Florida ($9.9 billion) |
| 2019 | $6.2 million | $15.0 million | $17.9 million | $39.1 million | 5 | Barry, Louisiana ($21.4 million) |
| 2020 | $15.8 billion | $184.6 million | $1.7 billion | $17.7 billion | 63 | Laura, Louisiana ($10.7 billion) |
| 2021 | $8.6 billion | $3.6 billion | $9.1 million | $12.2 billion | 29 | Ida, Louisiana ($12.1 billion) |
| 2022 | $15.2 billion | $510.0 million | $239.1 million | $16.0 billion | 121 | Ian, Florida ($13.2 billion) |
| 2023 | $4.1 billion | $25.0 million | $21.8 million | $4.1 billion | 7 | Mawar, Guam ($4.0 billion) |
| 2024 | $5.3 billion | $870.0 million | $1.9 billion | $8.1 billion | 95 | Helene, Florida ($5.1 billion) |
| 2025 | $0 | $0 | $0 | $0 | 0 | none above $0 |
Partial year, not ranked: the 2026 details file (StormEvents_details-ftp_v1.0_d2026_c20260918.csv.gz) held 7 rows of these types and $434.5 million in damage at retrieval, the latest beginning in June 2026 (NOAA). The season was still under way, so the figure is not comparable with the full years. Source: NOAA NCEI Storm Events.
Puerto Rico, Guam and the island areas
Island areas are kept out of the state ranking. Their NOAA totals are below, with FEMA hurricane Public Assistance for declarations dated 2015 to 2025 beside them. The two columns measure different things and should not be divided into each other (NOAA NCEI Storm Events; OpenFEMA).
| Area (STATE value) | Rows | Episodes | Recorded damage | Deaths | FEMA PA, Hurricane incidents | FEMA PA, Hurricane, Tropical Storm or Typhoon |
|---|---|---|---|---|---|---|
| Guam | 51 | 28 | $6.0 billion | 17 | $75.6 million | $87.3 million |
| American Samoa | 5 | 4 | $55.0 million | 0 | $10.5 million | $10.5 million |
| Puerto Rico | 69 | 8 | $5.0 million | 0 | $37.4 billion | $37.5 billion |
| Virgin Islands | 9 | 5 | $0 | 0 | $22.1 billion | $22.1 billion |
Puerto Rico is the sharpest gap in the file. Its hurricane-type rows sum to $5.0 million, while Flash Flood and Flood rows filed under the same NOAA episodes carry $18.3 billion (NOAA), and FEMA has obligated $37.4 billion in hurricane Public Assistance there, with $22.1 billion more in the Virgin Islands (OpenFEMA). Anyone ranking hurricane damage from the hurricane event type alone would leave Puerto Rico near zero.
The GUAM value in the STATE column covers more than Guam. Its rows are filed under forecast zones named Guam and Northern Marianas, Saipan, Micronesia, Belau, Rota and Marshall Islands, so its $6.0 billion mixes the Guam zone ($4.0 billion) with the Northern Mariana Islands and other western Pacific zones (NOAA NCEI Storm Events). It is shown as filed, not split.
The flood rows behind the storms
Inland flooding from a tropical system is usually logged as Flash Flood or Flood, not under the hurricane types. The link is in the file: NOAA files those rows under the same EPISODE_ID as the hurricane rows when one office treats them as one system. Of the 468 episodes with hurricane-type rows, 160 also hold Flash Flood or Flood rows, and 159 of those narratives name a hurricane, tropical storm, typhoon or cyclone outright (NOAA NCEI Storm Events).
| State or area | Flood rows in the same episodes | Hurricane-type rows | Combined |
|---|---|---|---|
| Texas | $43.7 billion | $10.1 billion | $53.8 billion |
| Puerto Rico | $18.3 billion | $5.0 million | $18.3 billion |
| Florida | $2.0 billion | $38.4 billion | $40.4 billion |
| North Carolina | $1.8 billion | $2.0 billion | $3.8 billion |
| Louisiana | $233.4 million | $26.7 billion | $26.9 billion |
| South Carolina | $22.0 million | $543.7 million | $565.7 million |
| Hawaii | $15.1 million | $10,000 | $15.1 million |
| Alabama | $1.7 million | $337.5 million | $339.1 million |
These rows add $66.1 billion and 195 deaths, $63.8 billion of it in Flash Flood rows (NOAA). It is a floor, not a full count: flooding logged by a different office, or under a separate episode, is not linked and is not added. For deaths in Flash Flood events of every cause, see flash flood deaths by state; for insured flood losses, flood claims by state. Source: NOAA NCEI Storm Events.
NOAA damage against FEMA spending
FEMA Public Assistance pays state, local and tribal governments and some nonprofits for debris removal, emergency work and rebuilding public facilities. It is not a damage estimate, and NOAA’s Storm Events damage is not a spending record. The comparison below asks only whether the two rank states in a similar order. FEMA amounts are obligations to date for declarations dated 2015 to 2025 with incident type Hurricane, from OpenFEMA FemaWebDisasterSummaries v1 joined to OpenFEMA DisasterDeclarationsSummaries v2; amounts by state are covered in FEMA spending by state.
| State | NOAA recorded damage | NOAA rank | FEMA hurricane Public Assistance | FEMA rank | Declarations | Largest declaration by PA (FEMA title) |
|---|---|---|---|---|---|---|
| Florida | $38.4 billion | 1 | $11.4 billion | 1 | 28 | Hurricane Ian |
| Louisiana | $26.7 billion | 2 | $7.3 billion | 2 | 15 | Hurricane Ida |
| Texas | $10.1 billion | 3 | $3.5 billion | 3 | 5 | Hurricane Harvey |
| Georgia | $3.2 billion | 4 | $2.1 billion | 4 | 10 | Hurricane Helene |
| New York | $18.9 million | 10 | $1.7 billion | 5 | 5 | Tropical Storm Isaias |
| North Carolina | $2.0 billion | 5 | $1.3 billion | 6 | 11 | Hurricane Florence |
| South Carolina | $543.7 million | 6 | $994.6 million | 7 | 12 | Hurricane Helene |
| New Jersey | $0 | unranked | $398.1 million | 8 | 3 | Remnants of Hurricane Ida |
| Alabama | $337.5 million | 7 | $386.1 million | 9 | 9 | Hurricane Sally |
| Mississippi | $144.0 million | 8 | $165.1 million | 10 | 9 | Hurricane Zeta |
| Pennsylvania | $0 | unranked | $109.1 million | 11 | 1 | Remnants of Hurricane Ida |
| Virginia | $4.2 million | 11 | $90.1 million | 12 | 4 | Tropical Storm Michael |
| Connecticut | $54.3 million | 9 | $54.4 million | 13 | 4 | Tropical Storm Isaias |
| Maryland | $3.0 million | 12 | $14.1 million | 16 | 1 | Tropical Storm Isaias |
Across the 15 states with a positive value on both measures, the Spearman rank correlation is 0.92; counting every state with a value on either side as a zero on the other (24 states) it is 0.69. Widening FEMA’s side to incident types Hurricane, Tropical Storm and Typhoon gives 0.91 over 15 states, a check worth making because some recent declarations for hurricanes carry the Tropical Storm incident type (OpenFEMA). The largest disagreement is New York: 5th for FEMA money ($1.7 billion) and 10th for NOAA damage ($18.9 million). New Jersey, Pennsylvania, California and Delaware received FEMA hurricane Public Assistance but have no positive damage in NOAA’s hurricane-type rows. Where a storm’s remnants did their harm through inland rain, NOAA usually files that damage under flood types, so gaps of this kind are expected rather than errors (NOAA, OpenFEMA).
Not the billion-dollar record
NOAA publishes two very different damage figures. The billion-dollar disaster record (NOAA NCEI Billion-Dollar Weather and Climate Disasters) is an aggregate archive: one cost per disaster, built from insured and uninsured losses, public assistance and other sources, ending with 2024 events. Storm Events is a row-level log of local NWS damage estimates. For 2015 to 2024, the archive lists 29 tropical cyclones costing $699.7 billion before inflation adjustment; the Storm Events hurricane, surge and tropical storm rows for the same years sum to $87.6 billion, or 13% (NOAA NCEI).
Neither is wrong. The archive is the better national cost figure; Storm Events is the only one of the two that can be broken down by state, episode and event type, which is why this report uses it. Read its state totals as a lower bound and a ranking aid, not as the full cost of any storm. A tornado-season view built from the same database is in tornado damage by state. Source: NOAA NCEI.
Data treatment
| Rule | Rows affected | Treatment |
|---|---|---|
| Blank DAMAGE_PROPERTY (not estimated) | 987 | Excluded from damage sums and medians. |
| DAMAGE_PROPERTY recorded as 0.00K | 1,675 | Kept as zero; medians use positive estimates only. |
| Rows keyed to a forecast zone (CZ_TYPE Z) | 4,293 | Ranked by state and episode; no county ranking is possible. |
| Rows keyed to a county (CZ_TYPE C) | 2 | Kept and counted with their state. |
| Marine or non-state STATE values | 0 | Would be excluded. None occur for these event types. |
| Island areas in the STATE column | 134 | Reported separately, not ranked. |
| Duplicate EVENT_ID | 0 | None found, so no row is counted twice. |
| Crop damage (DAMAGE_CROPS) | $7.4 billion | Not added to property damage. |
| Partial year 2026 | 7 | Excluded from every ranking; reported in one labelled note. |
Method
How we counted. We downloaded the NOAA NCEI Storm Events details files for 2015 to 2026 on 6 October 2026 and kept rows with EVENT_TYPE Hurricane (Typhoon), Storm Surge/Tide, Tropical Storm or Tropical Depression (4,295 rows, 2015 to 2025). DAMAGE_PROPERTY strings such as 500.00K were converted to dollars; 987 blank values (not estimated) were excluded and 1,675 recorded zeros kept as zero. Deaths are DEATHS_DIRECT plus DEATHS_INDIRECT. Episodes are grouped on EPISODE_ID. Storm names come only from EPISODE_NARRATIVE: the storm name mentioned most often in an episode’s narrative, with candidate names drawn from the narratives themselves; 22 episodes name none and stay unnamed. Flash Flood and Flood rows were linked only where they share an EPISODE_ID with a hurricane-type row and are reported separately, never added to the state ranking. FEMA Public Assistance is totalObligatedAmountPa for non-Biological declarations with incident type Hurricane dated 2015 to 2025. Spearman correlations use average ranks for ties. Per-resident figures divide 11 years of damage by 2025 Census population. All dollars are nominal.
Reproduce this
Reproduce this
- Endpoint
https://www.ncei.noaa.gov/pub/data/swdi/stormevents/csvfiles/- Query
StormEvents_details-ftp_v1.0_d{YEAR}_c{STAMP}.csv.gz for 2015 to 2026; keep EVENT_TYPE in ('Hurricane (Typhoon)', 'Storm Surge/Tide', 'Tropical Storm', 'Tropical Depression'); parse DAMAGE_PROPERTY K/M/B suffixes; group on STATE and EPISODE_ID- Rows retrieved
- 4,295 rows, 2015 to 2025; 7 rows in the partial 2026 file
- Retrieved
- 6 October 2026
Files used, with the NCEI creation stamp (c) in each name: StormEvents_details-ftp_v1.0_d2015_c20260323.csv.gz, StormEvents_details-ftp_v1.0_d2016_c20260323.csv.gz, StormEvents_details-ftp_v1.0_d2017_c20260519.csv.gz, StormEvents_details-ftp_v1.0_d2018_c20260323.csv.gz, StormEvents_details-ftp_v1.0_d2019_c20260323.csv.gz, StormEvents_details-ftp_v1.0_d2020_c20260323.csv.gz, StormEvents_details-ftp_v1.0_d2021_c20260323.csv.gz, StormEvents_details-ftp_v1.0_d2022_c20260625.csv.gz, StormEvents_details-ftp_v1.0_d2023_c20260323.csv.gz, StormEvents_details-ftp_v1.0_d2024_c20260728.csv.gz, StormEvents_details-ftp_v1.0_d2025_c20260819.csv.gz, StormEvents_details-ftp_v1.0_d2026_c20260918.csv.gz. NCEI reissues a year’s file with a new c-stamp when records are corrected, so a later download may differ slightly. Column meanings follow the NCEI Storm Data bulk CSV format documentation.
Reproduce this
- Endpoint
https://www.fema.gov/api/open/v1/FemaWebDisasterSummaries- Query
$top=5000 paged with $skip, checked against $inlinecount=allpages- Rows retrieved
- 4,036 disaster summary rows
- Retrieved
- 5 October 2026
Join on disasterNumber to https://www.fema.gov/api/open/v2/DisasterDeclarationsSummaries for state, incidentType and declarationDate; keep incidentType Hurricane. No API key is required. Obligations change as FEMA pays, so a later pull will show higher figures for recent disasters.
What this does not show
What this does not show
- Recorded estimates, not losses. NWS offices enter damage from emergency managers, media and other reports, rounded and in nominal dollars. A zero may mean no damage or none obtained.
- Event type is a filing choice. Inland flooding from a hurricane is usually a Flash Flood or Flood row; the same-episode link catches part of it, not all.
- No county view. These event types are filed by forecast zone, so county rankings cannot be built from them.
- Not insured or federal losses. NFIP claims, private insurance and FEMA grants are separate records with their own coverage; FEMA Public Assistance is compared by rank only.
- Storm names are narrative-based. A storm whose narratives do not name it is undercounted in the per-storm table.
- Short window. 11 seasons dominated by a few landfalls are too few to read a trend or a probability.
- No advice. For preparedness, see FEMA’s Ready.gov hurricane page and the National Hurricane Center; for recovery programs, your state emergency management agency.
Most quotable figures
- Florida recorded $38.4 billion of the $81.5 billion in US hurricane, tropical storm and storm surge damage in NOAA Storm Events records for 2015 to 2025, 47% (NOAA NCEI).
- Louisiana logged $5,799 of recorded hurricane damage per resident over 2015 to 2025, the most of any state (NOAA NCEI, Census Vintage 2025).
- Five storm episodes hold 58% of all hurricane-type damage NOAA recorded from 2015 to 2025 (NOAA NCEI).
- Ian in Florida is the costliest single NOAA episode of 2015 to 2025, at $13.2 billion of recorded damage (NOAA NCEI).
- Flash Flood and Flood rows filed under the same NOAA storm episodes add $66.1 billion to the hurricane-type total for 2015 to 2025 (NOAA NCEI).
- NOAA Storm Events hurricane rows for 2015 to 2024 sum to 13% of the tropical cyclone cost in NOAA’s own billion-dollar archive (NOAA NCEI).
Questions this report answers
Which state has the most hurricane damage?
Florida, with $38.4 billion of recorded property damage in NOAA hurricane, surge and tropical storm rows for 2015 to 2025, followed by Louisiana with $26.7 billion (NOAA NCEI).
Which state has the most hurricane damage per resident?
Louisiana, at $5,799 per 2025 resident over 2015 to 2025 (NOAA NCEI, Census).
What was the costliest hurricane episode in the records?
Episode 174632, Ian in Florida (September 2022), with $13.2 billion of recorded damage in these rows (NOAA NCEI).
How much hurricane damage did NOAA record in total?
$87.6 billion for 2015 to 2025 across the 50 states, DC and island areas, of which $81.5 billion is in the states and DC. Flash Flood and Flood rows in the same episodes add $66.1 billion (NOAA NCEI).
Why is Puerto Rico so low in the NOAA figures?
Its hurricane-type rows sum to $5.0 million; most recorded storm damage there sits in flood rows, and FEMA’s hurricane Public Assistance for Puerto Rico is $37.4 billion (NOAA NCEI, OpenFEMA).
Does this tell me my own hurricane risk or insurance needs?
No. It describes recorded damage only. See the National Hurricane Center, FEMA’s Ready.gov hurricane page and your state emergency management agency.
How to cite
Remediation Insider. Hurricane Damage by State: NOAA Storm Records, 2015 to 2025. https://remediationinsider.com/hurricane-damage-by-state/ (retrieved 6 October 2026).
Data and tables in this report are released under CC BY 4.0. Attribution: Remediation Insider.
Sources
- NOAA National Centers for Environmental Information. NOAA NCEI Storm Events Database, bulk details files 2015 to 2026, csvfiles directory. Retrieved 6 October 2026.
- NOAA NCEI. NCEI Storm Data bulk CSV format documentation. Field definitions for DAMAGE_PROPERTY, EPISODE_ID, CZ_TYPE and fatality fields.
- National Weather Service. NWS Instruction 10-1605, Storm Data Preparation (26 July 2021). Event type definitions, direct and indirect fatalities and damage estimates.
- FEMA. OpenFEMA FemaWebDisasterSummaries v1. Retrieved 5 October 2026.
- FEMA. OpenFEMA DisasterDeclarationsSummaries v2. Retrieved 5 October 2026.
- NOAA NCEI. NOAA NCEI Billion-Dollar Weather and Climate Disasters, events 1980 to 2024.
- US Census Bureau Population Estimates, Vintage 2025. 2025 resident population.
- No survey, interview or physical inspection was conducted for this report. Every figure is computed at build time from the retrieved public files.
This product uses the Federal Emergency Management Agency’s OpenFEMA API, but is not endorsed by FEMA. The Federal Government or FEMA cannot vouch for the data or analyses derived from these data after the data have been retrieved from the Agency’s website(s).